
MATLAB: An Introduction with Applications
6th Edition
ISBN: 9781119256830
Author: Amos Gilat
Publisher: John Wiley & Sons Inc
expand_more
expand_more
format_list_bulleted
Related questions
Question

Transcribed Image Text:2.
3.
4.
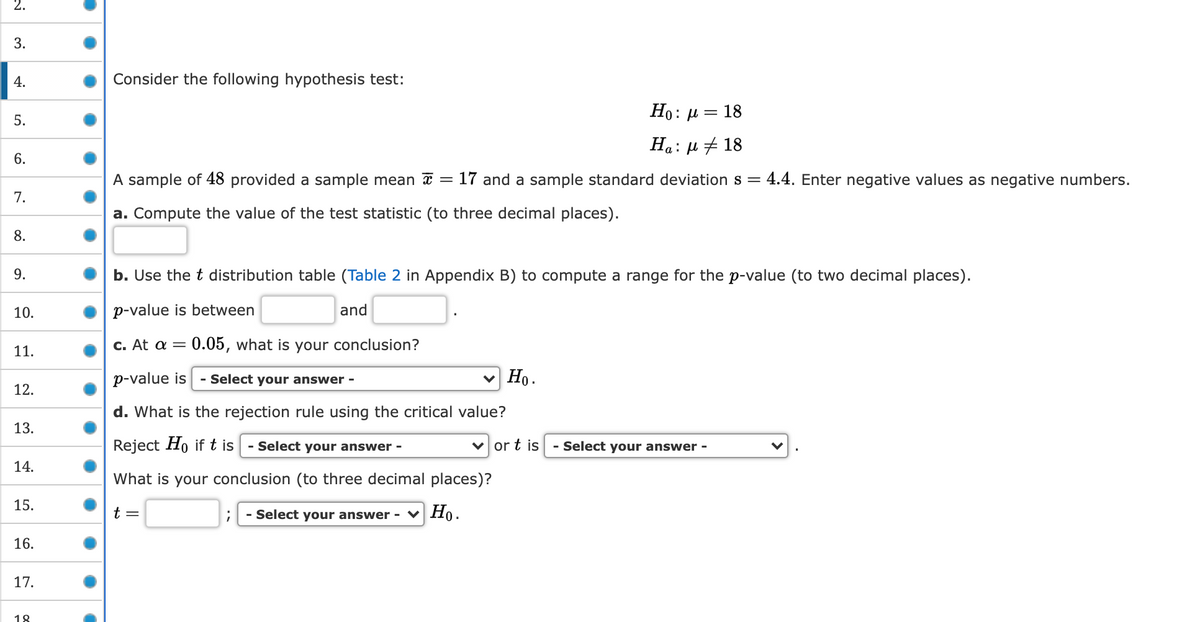
Consider the following hypothesis test:
Но: и
= 18
Ha: µ # 18
6.
A sample of 48 provided a sample mean x = 17 and a sample standard deviations =
4.4. Enter negative values as negative numbers.
7.
a. Compute the value of the test statistic (to three decimal places).
8.
9.
b. Use the t distribution table (Table 2 in Appendix B) to compute a range for the p-value (to two decimal places).
10.
p-value is between
and
C. At α -
0.05, what is your conclusion?
11.
p-value is
- Select your answer -
v Ho.
12.
d. What is the rejection rule using the critical value?
13.
Reject Ho if t is
- Select your answer -
V or t is
- Select your answer -
14.
What is your conclusion (to three decimal places)?
15.
t =
- Select your answer - v Họ.
16.
17.
18
5.
Expert Solution
This question has been solved!
Explore an expertly crafted, step-by-step solution for a thorough understanding of key concepts.

Step by stepSolved in 2 steps with 2 images

Knowledge Booster

Similar questions
- 1. The fuel efficiency of a new model pick-up truck (truck) is measured in miles per gallon (mpg). A company claims that their new truck gets 25 mpg on average. A consumer group thinks the company is lying and claims that the mean mileage for all the trucks is less than 25 mpg. In a random sample, of forty-five of these trucks the mean mpg was 23.3 mpg with a standard deviation of 5.1 mpg. a. Conduct a hypothesis test to test the consumer group's claim at the 5% significance level. Be sure to state you Ho and Ha, your test statistic and p- value, whether or not you reject Ho and whether you support the claim. b. Write a complete sentence describing what a Type I error is in context. c. Write a complete sentence describing what a Type II error is in context.arrow_forward15. The Exotic Fruit Juice Co. sell cartons of Passion Fruit and Orange fruit juice. The amount of liquid in each carton is normally distributed with a mean of 266ml and a standard deviation of 20ml. Cartons containing more than 300ml produce no profit. What percentage of cartons will this be?arrow_forward. A medical researcher wishes to see whether the pulse rate of smokers are higher than the pulse rates of non-smokers. Samples of 100 smokers and 100 nonsmokers are selected. The results are shown below. Can the researcher conclude at an alpha = 0.05, that smokers have higher pulse rates than nonsmokers? Smokers Non-Smokers Mean = 90 Mean = 88 Standard Deviation = 5 Standard Deviation = 6arrow_forward
- 3. The average height of females in the freshman class of a certain college has been 162.5 centimeters with a standard deviation of 6.9 centimeters. Is there reason to believe that there has been a change in the average height if a random sample of 50 females in the present freshman class has an avèrage height of 165.2 centimeters? Use a 0.02 level of significance.arrow_forward19. Assume that the sample has been randomly selected from a population that has a normal distribution. The standard deviation of math test scores at one high school is 16.1. A teacher claims that the standard deviation of the girls' test scores is smaller than 16.1. A random sample of 22 girls results in scores with a standard deviation of 14.3. Use a significance level of 0.01 to test the teacher's claim. Show work.arrow_forward3. According to the National Center for Health Statistics, the mean weight for an adult female inthe United States is 164.7 pounds. A group promoting healthier eating habits feels strongly thatit has made an impact in one community by reducing the mean weight of women in thatcommunity. A simple random sample of 39 women in this community yielded a mean weight of162.9 pounds. Assuming that the population standard deviation is 5.6 pounds, is the sufficientevidence at a a = 0.05 significance level to say that the mean weight of women in thiscommunity is lower than 164.7 pounds?arrow_forward
arrow_back_ios
arrow_forward_ios
Recommended textbooks for you
- MATLAB: An Introduction with ApplicationsStatisticsISBN:9781119256830Author:Amos GilatPublisher:John Wiley & Sons Inc
 Probability and Statistics for Engineering and th...StatisticsISBN:9781305251809Author:Jay L. DevorePublisher:Cengage Learning
 Statistics for The Behavioral Sciences (MindTap C...StatisticsISBN:9781305504912Author:Frederick J Gravetter, Larry B. WallnauPublisher:Cengage Learning
  Elementary Statistics: Picturing the World (7th E...StatisticsISBN:9780134683416Author:Ron Larson, Betsy FarberPublisher:PEARSON
 The Basic Practice of StatisticsStatisticsISBN:9781319042578Author:David S. Moore, William I. Notz, Michael A. FlignerPublisher:W. H. Freeman
 Introduction to the Practice of StatisticsStatisticsISBN:9781319013387Author:David S. Moore, George P. McCabe, Bruce A. CraigPublisher:W. H. Freeman
MATLAB: An Introduction with Applications
Statistics
ISBN:9781119256830
Author:Amos Gilat
Publisher:John Wiley & Sons Inc
Probability and Statistics for Engineering and th...
Statistics
ISBN:9781305251809
Author:Jay L. Devore
Publisher:Cengage Learning
Statistics for The Behavioral Sciences (MindTap C...
Statistics
ISBN:9781305504912
Author:Frederick J Gravetter, Larry B. Wallnau
Publisher:Cengage Learning
Elementary Statistics: Picturing the World (7th E...
Statistics
ISBN:9780134683416
Author:Ron Larson, Betsy Farber
Publisher:PEARSON
The Basic Practice of Statistics
Statistics
ISBN:9781319042578
Author:David S. Moore, William I. Notz, Michael A. Fligner
Publisher:W. H. Freeman
Introduction to the Practice of Statistics
Statistics
ISBN:9781319013387
Author:David S. Moore, George P. McCabe, Bruce A. Craig
Publisher:W. H. Freeman