MATLAB: An Introduction with Applications
6th Edition
ISBN: 9781119256830
Author: Amos Gilat
Publisher: John Wiley & Sons Inc
expand_more
expand_more
format_list_bulleted
Question

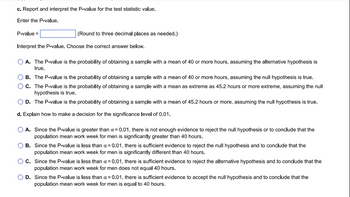
Transcribed Image Text:c. Report and interpret the P-value for the test statistic value.
Enter the P-value.
P-value =
(Round to three decimal places as needed.)
Interpret the P-value. Choose the correct answer below.
A. The P-value is the probability of obtaining a sample with a mean of 40 or more hours, assuming the alternative hypothesis is
true.
B. The P-value is the probability of obtaining a sample with a mean of 40 or more hours, assuming the null hypothesis is true.
C. The P-value is the probability of obtaining a sample with a mean as extreme as 45.2 hours or more extreme, assuming the null
hypothesis is true.
D. The P-value is the probability of obtaining a sample with a mean of 45.2 hours or more, assuming the null hypothesis is true.
d. Explain how to make a decision for the significance level of 0.01.
A. Since the P-value is greater than α = 0.01, there is not enough evidence to reject the null hypothesis or to conclude that the
population mean work week for men is significantly greater than 40 hours.
B. Since the P-value is less than α = 0.01, there is sufficient evidence to reject the null hypothesis and to conclude that the
population mean work week for men is significantly different than 40 hours.
C. Since the P-value is less than α = 0.01, there is sufficient evidence to reject the alternative hypothesis and to conclude that the
population mean work week for men does not equal 40 hours.
D. Since the P-value is less than α = 0.01, there is sufficient evidence to accept the null hypothesis and to conclude that the
population mean work week for men is equal to 40 hours.

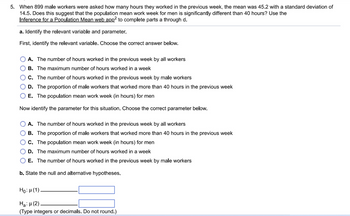
Transcribed Image Text:5. When 899 male workers were asked how many hours they worked in the previous week, the mean was 45.2 with a standard deviation of
14.5. Does this suggest that the population mean work week for men is significantly different than 40 hours? Use the
Inference for a Population Mean web app² to complete parts a through d.
a. Identify the relevant variable and parameter.
First, identify the relevant variable. Choose the correct answer below.
A. The number of hours worked in the previous week by all workers
B. The maximum number of hours worked in a week
C. The number of hours worked in the previous week by male workers
D. The proportion of male workers that worked more than 40 hours in the previous week
E. The population mean work week (in hours) for men
Now identify the parameter for this situation. Choose the correct parameter below.
A. The number of hours worked in the previous week by all workers
B. The proportion of male workers that worked more than 40 hours in the previous week
C. The population mean work week (in hours) for men
D. The maximum number of hours worked in a week
E. The number of hours worked in the previous week by male workers
b. State the null and alternative hypotheses.
Ho: μ(1)
Ha:μ (2)
(Type integers or decimals. Do not round.)
Expert Solution
This question has been solved!
Explore an expertly crafted, step-by-step solution for a thorough understanding of key concepts.
This is a popular solution
Trending nowThis is a popular solution!
Step by stepSolved in 4 steps

Knowledge Booster
Similar questions
- The governor of a state wanted to assess the public education system of the state. She instructed a group of researchers to create a test to assess the knowledge of every high school senior in the state. The researchers administered the tests and found that the average score was 74 points out of 100, with a standard deviation of 20 points. Complete parts (a) through (c) below. a. Identify the population and variable. Choose the correct population below. A. The population is the group of all high school seniors in the state. O B. The population is the group of every state's governor. O C. The population is the group of all high school teachers in the state. O D. The population is the group of all high school students in the state. Choose the correct variable below. O A. The variable is the number of high school seniors. O B. The variable is the test length. YC. The variable is the test score. O D. The variable is the number of high school students. b. For samples of size 225, find the…arrow_forwardIn the 1992 presidential election, Alaska's 40 election districts averaged 2002 votes per district for President Clinton. The standard deviation was 589. (There are only 40 election districts in Alaska.) The distribution of the votes per district for President Clinton was bell-shaped. Let X = number of votes for President Clinton for an election district. (Source: The World Almanac and Book of Facts) Round all answers except part e. to 4 decimal places. a. What is the distribution of X? X N b. Is 2002 a population mean or a sample mean? Select an answer ✓ c. Find the probability that a randomly selected district had fewer than 2058 votes for President Clinton. d. Find the probability that a randomly selected district had between 1998 and 2225 votes for President Clinton. e. Find the third quartile for votes for President Clinton. Round your answer to the nearest whole number.arrow_forwardPlease find the range, sample standard deviation, and interquartile range (IQR) of the following data set. 23 30 37 53 62 range sample standard deviation IQR = = 88 93 95 95 98 (Please enter an exact answer.) (Please show your answer to one decimal place.) (Please enter an exact answer.)arrow_forward
- a. Develop a hypothesis test that can be used to determine whether the mean annual consumption in Webster City is higher than the national mean. Ho: $21.5 Ha: >21.5 b. What is a point estimate of the difference between mean annual consumption in Webster City and the national mean? (2 decimals) c. At a = 0.01, test for a significant difference by completing the following. Calculate the value of the test statistic (2 decimals). The p-value is Reject the null hypothesis? (4 decimals) Yes v What is your conclusion? Conclude the population mean consumption of milk in Webster City is greater thaarrow_forwardWhich of the following answers is correct and why? I really need an explanation for this question.arrow_forwardPlease answer the following parts d, e and f only, as a, b and c were alreday provided. Also, please show using graphing calculator and not Excel. Thanks. Adult IQ scores can be modeled using a normal model with mean 100 and a standadrd deviation of 15. a. Find the proportion of IQ scores that are less than 115. b. Find the proportion of IQ scores that are greater than 131.5. c. Find the proportion of IQ scores between 90 and 110. d. Find the proportion of IQ scores that are betewwn 110 and 120. e. Find the IQ score above which there are 10% of the scores. f. Find the IQ score below which there are 20% of the scores.arrow_forward
- 1. higher or lower 2. Slower or fasterarrow_forwardUsing PivotTables, find the mean and standard deviation of sales by region in the data provided. LOADING... Click the icon to view the data. Question content area bottom Part 1 Complete the table below. (Type integers or decimals rounded to two decimal places as needed.) Average of Amount StdDev of Amount East enter your response here enter your response here North enter your response here enter your response here South enter your response here enter your response here West enter your response here enter your response here Grand Total enter your response here enter your response herearrow_forwardGiven the data set below find the following; 45, 34, 65, 20, 15, 25 a. Compute the sample mean b. Compute the sample standard deviation c. Compute the standard error of the mean.arrow_forward
- 12. Stem and leaf Plot: (Sample )Variable: Gas $ Key: 12 = 1:2 1 : 2 2 : 3 : 4 : 5 : 55 6 : 7 : 88 8 : 9 12a. Use the above Stem and leaf plot and calculate the range. 12b. Use the above Stem and leaf plot and calculate the Quadratic Mean. 12c. Calculate the upper fence. 12d. Estimate the standard deviation.arrow_forwardPlease help me with this question.arrow_forward
arrow_back_ios
arrow_forward_ios
Recommended textbooks for you
 MATLAB: An Introduction with ApplicationsStatisticsISBN:9781119256830Author:Amos GilatPublisher:John Wiley & Sons Inc
 Probability and Statistics for Engineering and th...StatisticsISBN:9781305251809Author:Jay L. DevorePublisher:Cengage Learning
 Statistics for The Behavioral Sciences (MindTap C...StatisticsISBN:9781305504912Author:Frederick J Gravetter, Larry B. WallnauPublisher:Cengage Learning
 Elementary Statistics: Picturing the World (7th E...StatisticsISBN:9780134683416Author:Ron Larson, Betsy FarberPublisher:PEARSON
 The Basic Practice of StatisticsStatisticsISBN:9781319042578Author:David S. Moore, William I. Notz, Michael A. FlignerPublisher:W. H. Freeman
 Introduction to the Practice of StatisticsStatisticsISBN:9781319013387Author:David S. Moore, George P. McCabe, Bruce A. CraigPublisher:W. H. Freeman

MATLAB: An Introduction with Applications
Statistics
ISBN:9781119256830
Author:Amos Gilat
Publisher:John Wiley & Sons Inc

Probability and Statistics for Engineering and th...
Statistics
ISBN:9781305251809
Author:Jay L. Devore
Publisher:Cengage Learning

Statistics for The Behavioral Sciences (MindTap C...
Statistics
ISBN:9781305504912
Author:Frederick J Gravetter, Larry B. Wallnau
Publisher:Cengage Learning

Elementary Statistics: Picturing the World (7th E...
Statistics
ISBN:9780134683416
Author:Ron Larson, Betsy Farber
Publisher:PEARSON

The Basic Practice of Statistics
Statistics
ISBN:9781319042578
Author:David S. Moore, William I. Notz, Michael A. Fligner
Publisher:W. H. Freeman

Introduction to the Practice of Statistics
Statistics
ISBN:9781319013387
Author:David S. Moore, George P. McCabe, Bruce A. Craig
Publisher:W. H. Freeman