
MATLAB: An Introduction with Applications
6th Edition
ISBN: 9781119256830
Author: Amos Gilat
Publisher: John Wiley & Sons Inc
expand_more
expand_more
format_list_bulleted
Related questions
Question
3) The following two sets of Excel output use are from the same data set as described above, but the first set of output is for the set of 35 CEO’s that earn the lowest total compensation and the second set of output is for a set of 40 CEO’s that earn the highest total compensation.
a) What is heteroscedasticity?
b) Why is heteroscedasticity a problem?
c) Based on a comparison of the two sets of output, does it appear that there is heteroscedasticity in the data set? Explain.
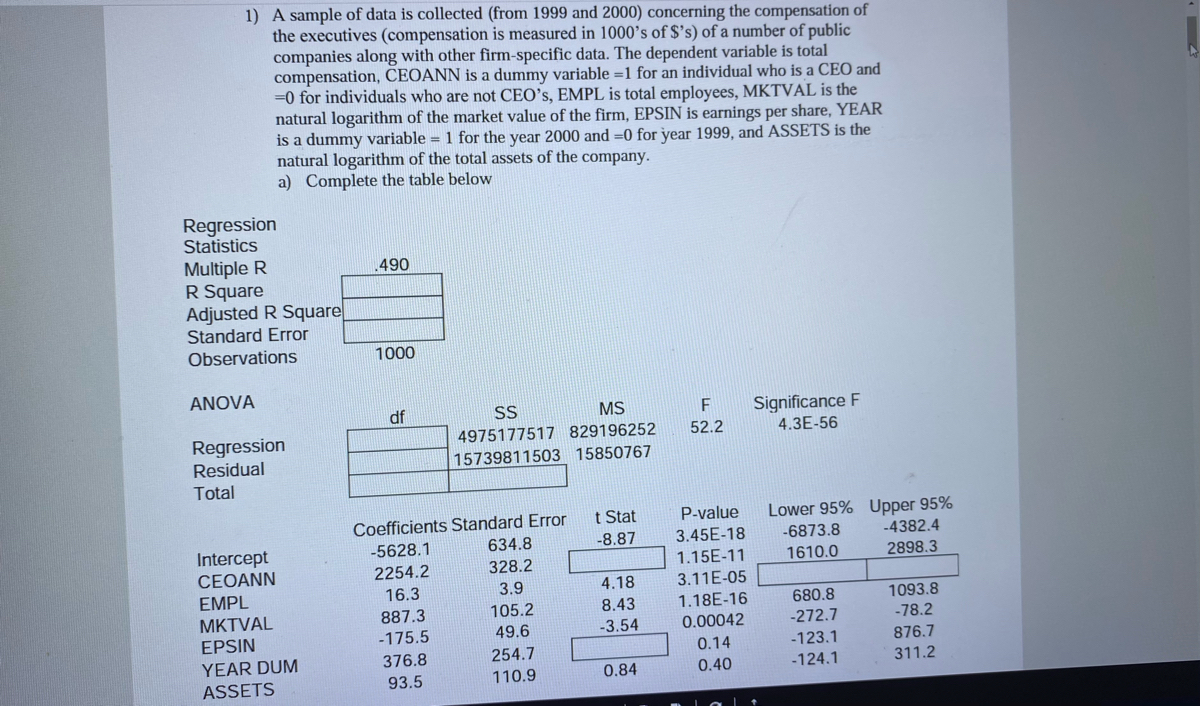

Transcribed Image Text:1) A sample of data is collected (from 1999 and 2000) concerning the compensation of
the executives (compensation is measured in 1000's of $'s) of a number of public
companies along with other firm-specific data. The dependent variable is total
compensation, CEOANN is a dummy variable =1 for an individual who is a CEO and
=0 for individuals who are not CEO's, EMPL is total employees, MKTVAL is the
natural logarithm of the market value of the firm, EPSIN is earnings per share, YEAR
is a dummy variable = 1 for the year 2000 and =0 for year 1999, and ASSETS is the
natural logarithm of the total assets of the company.
a) Complete the table below
Regression
Statistics
Multiple R
R Square
Adjusted R Square
Standard Error
Observations
490
1000
ANOVA
df
SS
MS
Significance F
4.3E-56
Regression
Residual
4975177517 829196252
52.2
15739811503 15850767
Total
Lower 95% Upper 95%
-4382.4
t Stat
P-value
Coefficients Standard Error
634.8
3.45E-18
1.15E-11
3.11E-05
1.18E-16
-5628.1
-8.87
-6873.8
Intercept
CEOANN
EMPL
МKTVAL
EPSIN
2254.2
328.2
1610.0
2898.3
16.3
3.9
4.18
680.8
1093.8
8.43
-3.54
887.3
105.2
49.6
0.00042
-272.7
-78.2
-175.5
0.14
-123.1
876.7
376.8
254.7
YEAR DUM
ASSETS
0.84
0.40
-124.1
311.2
93.5
110.9

Transcribed Image Text:Regression
Statistics
Multiple R
R Square
Adjusted R Square
Standard Error
Observations
0.490
0.240
0.236
3981
1000
ANOVA
df
SS
MS
Significance F
Regression
Residual
4963901656 992780331
62.7
7.34E-57
994
15751087364 15846164
Total
999
20714989020
Coefficients Standard Error
t Stat
P-value
Lower 95% Upper 95%
Intercept
CEOANN
-5390.1
568.5
-9.48
1.80E-20
-6505.8
-4274.4
2259.2
328.1
6.88
1.03E-11
1615.2
2903.1
EMPL
17.3
3.7
4.62
4.26E-06
9.9
24.6
MKTVAL
944.8
30.1
31.39
3.89E-30
885.8
1003.8
EPSIN
-171.8
49.4
-3.48
0.00052
-268.7
-74.9
YEAR DUM
401.0
253.1
1.58
0.113
-95.6
897.6
Expert Solution
This question has been solved!
Explore an expertly crafted, step-by-step solution for a thorough understanding of key concepts.

Step by stepSolved in 4 steps

Knowledge Booster

Similar questions
- 2. Management training programs are often instituted to teach supervisory skills and thereby increase productivity. Suppose a university psychologist administers a set of examination to each of 10 graduating students before such training program begins and then administers similar examinations at the end of the program. Examinations are designed to measure supervisory skills, with highest scores indicating increased skills. The results are shown below: Student Before Training After Training 1 63 78 2 93 92 3 84 91 4 72 80 5 TI 65 69 6 72 85 7 91 99 8 84 82 9 71 81 10 80 87 Do the data provide evidence that the training program is effective in increasing supervisory skills, as measured by the examination scores? Use 0.10 significance level. (critical value = +1.383)arrow_forwardYou will conduct a study of 100 people with cancer to better understand people's view the role of nutrition in their cancer diagnosis and treatment. This mixed methods study will include quantitative data collection from all 100 persons and qualitative data collection from about 20 persons. Your aims to to describe: o Describe sources of information about cancer-related nutrition (who did they learn cancer- related information from?) o Assess knowledge about cancer-related nutrition o Understand nutrition-related behaviors people changed due to their cancer diagnosis or treatment State which aims would best be measured with quantitative data and which aims would best be measured with qualitative data. Explain why you would use quantitative or qualitative data collection for each.arrow_forward4arrow_forward
- 3. Travelers who have no intention of showing up often fail to cancel their hotel reservations in a timely manner. These travelers are known, in the parlance of the hospitality trade, as "no-shows". To protect against no-shows and late cancellations, hotels invariably overbook rooms. A recent study examined the problems of over-booking rooms in the hotel industry. The following data, extracted from the study represent the daily numbers of late cancellations and no-shows for a random sample of 10 days at a hotel: 18, 16, 16, 16, 14, 18, 16, 18, 14, 19. c) Count the number of measurements that actually fall within the interval(-28, +2s) and express the interval count as a percentage of total number of measurements. at least 75% 100% 68% 95%arrow_forwardThe personality characteristics of business leaders (e.g., CEOS) are related to the operations of the businesses that they lead (Oreg & Berson, 2018). Traits like openness to experience are related to positive financial outcomes and other traits are related to negative financial outcomes for their businesses. Suppose that a board of directors is interested in evaluating the personality of their leadership. Among a sample of n = 16 managers, the sample mean of the openness to experiences dimension of personality was M = 4.50. Assuming that u = 4.24 and o = 1.05 (Cobb-Clark & Schurer, 2012), use a two-tailed hypothesis test with a = .05 to test the hypothesis that this company's business leaders' openness to experience is different from the population. Standard Normal Distribution Mean - 0.0 Standard Deviation 1.0 .7198 .1401 .1401 -3.0 -2.0 -1.0 0.0 1.0 2.0 3.0 -1.08 1.08 Step 1. Ho: ; H;: a = .05. Step 2. The critical region consists of Step 3. For these data the standard error is and…arrow_forwardThe more costly and time-consuming it is to export and import, the more difficult it is for local companies to be competitive and to reach international markets. As part of an initial investigation exploring foreign market entry, 9 countries were selected from each of four global regions. The cost associated with importing a standardized cargo of goods by sea transport in these countries (in US$ per container) is stored in the accompanying data table. Complete parts (a) through (d). East Asia & Pacific Eastern Europe & Central Asia Latin America & Caribbean Middle East & North Africa240 77 1200 466777 335 688 397266 396 970 554383 83 290 644580 150 545 181220 306 420 646389 1125 450 695233 655 583 754392 100 1500 779 c. At the 0.05 level of significance, is there evidence of a difference in the variation in cost of importing among the four global regions? Determine…arrow_forward
arrow_back_ios
arrow_forward_ios
Recommended textbooks for you
- MATLAB: An Introduction with ApplicationsStatisticsISBN:9781119256830Author:Amos GilatPublisher:John Wiley & Sons Inc
 Probability and Statistics for Engineering and th...StatisticsISBN:9781305251809Author:Jay L. DevorePublisher:Cengage Learning
 Statistics for The Behavioral Sciences (MindTap C...StatisticsISBN:9781305504912Author:Frederick J Gravetter, Larry B. WallnauPublisher:Cengage Learning
  Elementary Statistics: Picturing the World (7th E...StatisticsISBN:9780134683416Author:Ron Larson, Betsy FarberPublisher:PEARSON
 The Basic Practice of StatisticsStatisticsISBN:9781319042578Author:David S. Moore, William I. Notz, Michael A. FlignerPublisher:W. H. Freeman
 Introduction to the Practice of StatisticsStatisticsISBN:9781319013387Author:David S. Moore, George P. McCabe, Bruce A. CraigPublisher:W. H. Freeman
MATLAB: An Introduction with Applications
Statistics
ISBN:9781119256830
Author:Amos Gilat
Publisher:John Wiley & Sons Inc
Probability and Statistics for Engineering and th...
Statistics
ISBN:9781305251809
Author:Jay L. Devore
Publisher:Cengage Learning
Statistics for The Behavioral Sciences (MindTap C...
Statistics
ISBN:9781305504912
Author:Frederick J Gravetter, Larry B. Wallnau
Publisher:Cengage Learning
Elementary Statistics: Picturing the World (7th E...
Statistics
ISBN:9780134683416
Author:Ron Larson, Betsy Farber
Publisher:PEARSON
The Basic Practice of Statistics
Statistics
ISBN:9781319042578
Author:David S. Moore, William I. Notz, Michael A. Fligner
Publisher:W. H. Freeman
Introduction to the Practice of Statistics
Statistics
ISBN:9781319013387
Author:David S. Moore, George P. McCabe, Bruce A. Craig
Publisher:W. H. Freeman