
MATLAB: An Introduction with Applications
6th Edition
ISBN: 9781119256830
Author: Amos Gilat
Publisher: John Wiley & Sons Inc
expand_more
expand_more
format_list_bulleted
Related questions
Question
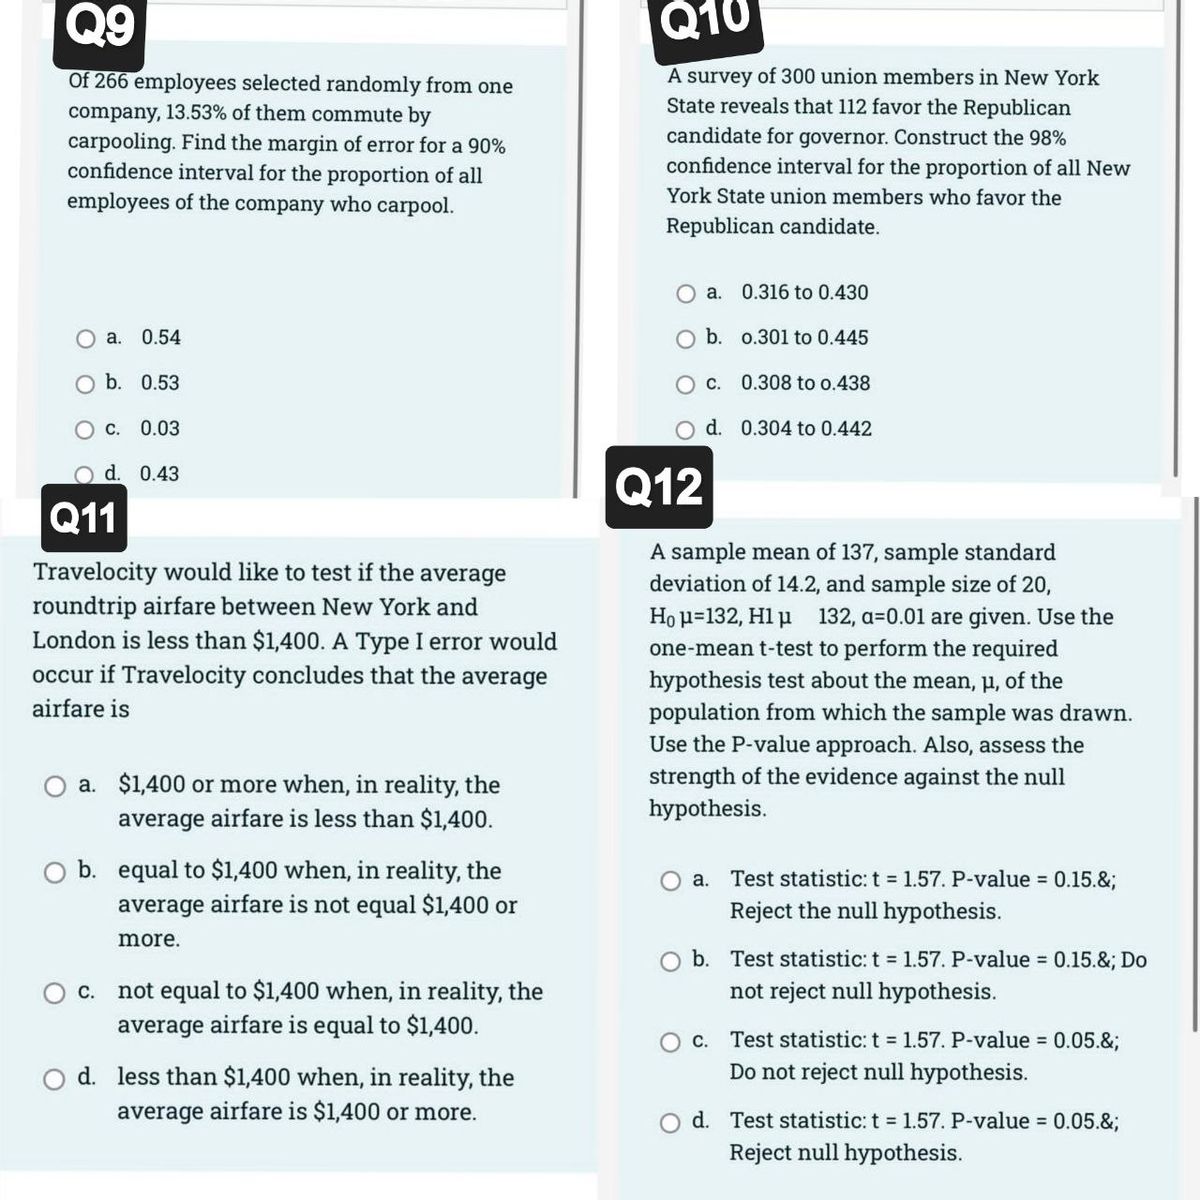

Transcribed Image Text:Q9
Of 266 employees selected randomly from one
company, 13.53% of them commute by
carpooling. Find the margin of error for a 90%
confidence interval for the proportion of all
employees of the company who carpool.
Oa. 0.54
O b. 0.53
OC. 0.03
d. 0.43
Q11
Travelocity would like to test if the average
roundtrip airfare between New York and
London is less than $1,400. A Type I error would
occur if Travelocity concludes that the average
airfare is
O a. $1,400 or more when, in reality, the
average airfare is less than $1,400.
O b. equal to $1,400 when, in reality, the
average airfare is not equal $1,400 or
more.
O c. not equal to $1,400 when, in reality, the
average airfare is equal to $1,400.
d. less than $1,400 when, in reality, the
average airfare is $1,400 or more.
Q10
A survey of 300 union members in New York
State reveals that 112 favor the Republican
candidate for governor. Construct the 98%
confidence interval for the proportion of all New
York State union members who favor the
Republican candidate.
O a.
O b.
O c.
d.
0.316 to 0.430
0.301 to 0.445
0.308 to 0.438
0.304 to 0.442
Q12
A sample mean of 137, sample standard
deviation of 14.2, and sample size of 20,
Ho μ=132, H1 μ 132, a=0.01 are given. Use the
one-mean t-test to perform the required
hypothesis test about the mean, μ, of the
population from which the sample was drawn.
Use the P-value approach. Also, assess the
strength of the evidence against the null
hypothesis.
a. Test statistic: t = 1.57. P-value = 0.15.&;
Reject the null hypothesis.
b. Test statistic: t = 1.57. P-value = 0.15.&; Do
not reject null hypothesis.
c. Test statistic: t = 1.57. P-value = 0.05.&;
Do not reject null hypothesis.
d. Test statistic: t = 1.57. P-value = 0.05.&;
Reject null hypothesis.
Expert Solution
This question has been solved!
Explore an expertly crafted, step-by-step solution for a thorough understanding of key concepts.

Step by stepSolved in 2 steps

Knowledge Booster

Similar questions
- In a recent survey of US adults, 40 people were asked the question: “Do you have dental insurance”. Of those surveyed, 8 responded that they had dental insurance. Use the “plus-four” method and the table below to find a 95% confidence interval for the true proportion of US adults who have dental insurance. z0.10 z0.05 z0.025 z0.01 z0.005 1.282 1.645 1.960 2.326 2.576arrow_forwardA 90% confidence interval for the difference between the proportion of college students who use flash cards for studying and high school students who use flash cards for studying is (0.13, 0.23). Then the Error is +5%. True Falsearrow_forwardA Gallup poll of 1487 adults showed that 43% of the respondents have Facebook pages. Construct a 95% confidence interval for the proportion of adults who have a Facebook page.arrow_forward
- In a survey funded by the UW school of medicine, 750 of 1000 adult Seattle residents said they did not believe they could come down with a sexually transmitted infection (STI). Construct a 95% confidence interval estimage of the proportion of adult Seattle residents who don't believe they can contract an STI. (Use a z score of 1.96 for your computations.) (.728, .772) (.723, .777) (.718, .782) (.713, .878) (.665, .835)arrow_forwardA survey of 240 teachers found that two-thirds of those surveyed do not live in Sydney. Can you conclude statistically that the population proportion who do not live in Sydney is less than 0.75? Use a 95% confidence interval. What is the confidence interval and is 0.75 within the interval?arrow_forwardA survey of 2450 golfers showed that 281 of them are left-handed. Construct a 90% confidence interval for the proportion of golfers that are left-handed. Question 10 options: (0.104, 0.125) (0.369, 0.451) (0.100, 0.130) (0.203, 0.293)arrow_forward
- Identify the t-score for a 95% confidence interval if the sample size is 15. t = the answer isnt 2.131 so what is the answer?arrow_forwardA study is conducted by a physical therapist to determine whether there is a difference in the proportion of men and women in the U.S. that participate in regular sustained physical activity. It is found that 22% of menout of 550 and 19.5% of women out of 450 participated in regular sustained physical activity. Construct a 90% confidence interval for the difference in proportions of men and women that participate in regular sustained and state your conclusion.arrow_forwardA recent poll indicated that 42% of men supported raises taxes to fund additional park services. The poll also found that 64% of women supported such a tax. The sample consisted of 29 men and 25 women. Construct a 90% confidence interval around the difference in proportions.arrow_forward
arrow_back_ios
arrow_forward_ios
Recommended textbooks for you
- MATLAB: An Introduction with ApplicationsStatisticsISBN:9781119256830Author:Amos GilatPublisher:John Wiley & Sons Inc
 Probability and Statistics for Engineering and th...StatisticsISBN:9781305251809Author:Jay L. DevorePublisher:Cengage Learning
 Statistics for The Behavioral Sciences (MindTap C...StatisticsISBN:9781305504912Author:Frederick J Gravetter, Larry B. WallnauPublisher:Cengage Learning
  Elementary Statistics: Picturing the World (7th E...StatisticsISBN:9780134683416Author:Ron Larson, Betsy FarberPublisher:PEARSON
 The Basic Practice of StatisticsStatisticsISBN:9781319042578Author:David S. Moore, William I. Notz, Michael A. FlignerPublisher:W. H. Freeman
 Introduction to the Practice of StatisticsStatisticsISBN:9781319013387Author:David S. Moore, George P. McCabe, Bruce A. CraigPublisher:W. H. Freeman
MATLAB: An Introduction with Applications
Statistics
ISBN:9781119256830
Author:Amos Gilat
Publisher:John Wiley & Sons Inc
Probability and Statistics for Engineering and th...
Statistics
ISBN:9781305251809
Author:Jay L. Devore
Publisher:Cengage Learning
Statistics for The Behavioral Sciences (MindTap C...
Statistics
ISBN:9781305504912
Author:Frederick J Gravetter, Larry B. Wallnau
Publisher:Cengage Learning
Elementary Statistics: Picturing the World (7th E...
Statistics
ISBN:9780134683416
Author:Ron Larson, Betsy Farber
Publisher:PEARSON
The Basic Practice of Statistics
Statistics
ISBN:9781319042578
Author:David S. Moore, William I. Notz, Michael A. Fligner
Publisher:W. H. Freeman
Introduction to the Practice of Statistics
Statistics
ISBN:9781319013387
Author:David S. Moore, George P. McCabe, Bruce A. Craig
Publisher:W. H. Freeman