
MATLAB: An Introduction with Applications
6th Edition
ISBN: 9781119256830
Author: Amos Gilat
Publisher: John Wiley & Sons Inc
expand_more
expand_more
format_list_bulleted
Related questions
Question
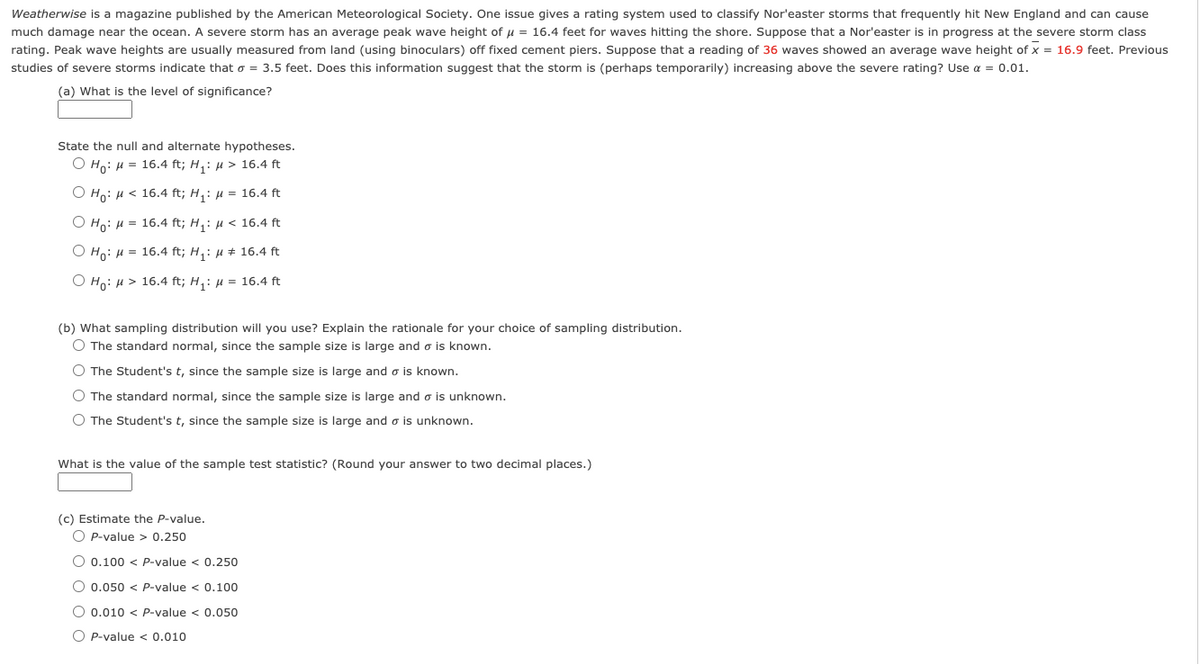

Transcribed Image Text:**Weatherwise** is a magazine published by the American Meteorological Society. One issue gives a rating system used to classify Nor'easter storms that frequently hit New England and can cause much damage near the ocean. A severe storm has an average peak wave height of \(\mu = 16.4\) feet for waves hitting the shore. Suppose that a Nor'easter is in progress at the severe storm class rating. Peak wave heights are usually measured from land (using binoculars) off fixed cement piers. Suppose that a reading of 36 waves showed an average wave height of \(\bar{x} = 16.9\) feet. Previous studies of severe storms indicate that \(\sigma = 3.5\) feet. Does this information suggest that the storm is (perhaps temporarily) increasing above the severe rating? Use \(\alpha = 0.01\).
### (a) What is the level of significance?
State the null and alternate hypotheses:
- \( H_0: \mu = 16.4 \text{ ft}; \; H_1: \mu > 16.4 \text{ ft} \)
- \( H_0: \mu < 16.4 \text{ ft}; \; H_1: \mu = 16.4 \text{ ft} \)
- \( H_0: \mu = 16.4 \text{ ft}; \; H_1: \mu < 16.4 \text{ ft} \)
- \( H_0: \mu = 16.4 \text{ ft}; \; H_1: \mu \neq 16.4 \text{ ft} \)
- \( H_0: \mu > 16.4 \text{ ft}; \; H_1: \mu = 16.4 \text{ ft} \)
### (b) What sampling distribution will you use? Explain the rationale for your choice of sampling distribution.
- \( \text{The standard normal, since the sample size is large and }\sigma \text{ is known.} \)
- \( \text{The Student's } t, \text{ since the sample size is large and }\sigma \text{ is known.} \)
- \( \text{The standard normal, since the sample size is large and }\sigma \text{ is unknown.} \)
- \( \text
Expert Solution
This question has been solved!
Explore an expertly crafted, step-by-step solution for a thorough understanding of key concepts.

This is a popular solution

Trending nowThis is a popular solution!

Step by stepSolved in 4 steps with 1 images

Knowledge Booster

Similar questions
- According to research, holiday shoppers spent an average of $364 over a holiday weekend in 2008. The accompanying data show the amount spent by a random sample of holiday shoppers during the same weekend in 2009. Complete below. Click the icon to view the data table. a. Retailers were concerned that the recent economic downturn was going to affect holiday sales. Does this sample support these concerns using a = 0.10? Determine the null and alternative hypotheses. Choose the correct answer below. O A. Ho: µS 364 and H1: µ > 364 More Info B. Ho: H= 364 and H,: µ #364 C. Ho: µ2 364 and H,: µ<364 $433 $268 $374 $239 $215 $211 O D. Ho: H#364 and H,: µ = 364 $356 $437 $382 $400 $327 $66 %3D $415 $429 $381 $283 Determine the critical value(s). The critical value(s) is(are) Print Done (Round to three decimal places as needed. Use a comma to separate answers as needed.) Determine the test statistic, t̟. Click to select your answer(s).arrow_forwardwords Font CP English Philippines) ype here to search 17 Paragraph a. What type of chart is being used to compare the data? M b. Fill in the following two-way frequency table for the data. Store 1 Store 2 Store 3 Month 1 Month 2 Total Ri 1 8 8 8 be 8 A Styles SAMSUNG Total 8 A A 12 Adobe Acrobat 16°C Sunnyarrow_forwardPLEASE I NEED HELP WITH THIS. (Please dont make it longer than 30 minutes I really need help.) :) please. With this research: The average temperature of Hamilton in January 2020 was less than 32°F (0°C). Weather in Hamilton in January 2020 (Ontario) - Detailed Weather Forecast for a Month (world-weather.info) You will need to calculate, explain,: B)Draw a graphic A)Calculates central trend measurements and data dispersion measurements. B)Draws the best adjusted line from a point cloud and indicates the type of correlation.arrow_forward
- Safari File Edit View History Bookmarks Window Help Fri Nov 19 10:29 AM primaverahs.strongmind.com PDF Jade Brissette - OneDrive - Letter of Rec. Phoenix...I District Listen DOCX PDF A standard deck of cards has 52 cards divided into four suits: hearts, clubs, diamonds, and spades. Jade Brissette, Jade.pdf Brissette.docx How would you find the experimental probability of drawing a heart from a standard deck of cards? Draw a card from the deck, record if it is a heart, then set the card to the side. Repeat 40 times. PDF Divide the number of results by 40. Transcprit Divide the number of hearts in the deck by 52. Divide the number of cards in the deck that are not hearts by 52. Greatest Influence Draw a card from the deck, record if it is a heart, then return the card to the deck. Repeat 40 Essay times. Divide the number of results by 40. act april Next > Climate Change Renewable Resources Probability Project PDF O Chat Jade Brissette Final Writing 12A WASHBA EXPRCSB CAP (15,379 (2,874…arrow_forwardThe Hill of Tara is located in south-central Meath, not far from Dublin, Ireland. Tara is of great cultural and archaeological importance, since it is by legend the seat of the ancient high kings of Ireland. For more information, see Tara: An Archaeological Survey, by Conor Newman, Royal Irish Academy, Dublin. Magnetic surveying is one technique used by archaeologists to determine anomalies arising from variations in magnetic susceptibility. Unusual changes in magnetic susceptibility might (or might not) indicate an important archaeological discovery. Let x be a random variable that represents a magnetic susceptibility (MS) reading for a randomly chosen site on the Hill of Tara. A random sample of 120 sites gave the readings shown in the table below. Magnetic Susceptibility Readings, centimeter-gram-second x 10-6 (cmg x 10-6) Magnetic Susceptibility 0 < x < 10 10 < x < 20 20 < x < 30 30 < x < 40 40 < x Number of Estimated Comment Readings 30 Probability = 0.25 "cool" 30/120 54/120…arrow_forwardDuring which month were there 150 tornadoes? Tornadoes per Month in Oklahoma 175 150 125 100 75 50 由25 Jan. Feb. Mar. Apr. May Jun. Jul. Aug. Sep. Oct. Nov. Dec. Month Enter Tornado Frequencyarrow_forward
- A histogram which is not symmetrically bell-shaped is called shrewed skewed stewed spoofedarrow_forwardThe lengths of 40 leaves of a plant are measured correct to the nearest millimeter. Less than Cumulative frequency of the data obtained is represented in the following table. Which central tendency will be most appropriate for the data set? Length (mm) Less than cum freq Less than 127 3 127-135 136-144 17 145-153 29 154-162 34 163-171 38 172-180 40 O a. mode O b. mean O. midrange O d. medianarrow_forwardThe Hill of Tara is located in south-central Meath, not far from Dublin, Ireland. Tara is of great cultural and archaeological importance, since it is by legend the seat of the ancient high kings of Ireland. For more information, see Tara: An Archaeological Survey, by Conor Newman, Royal Irish Academy, Dublin. Magnetic surveying is one technique used by archaeologists to determine anomalies arising from variations in magnetic susceptibility. Unusual changes in magnetic susceptibility might (or might not) indicate an important archaeological discovery. Let x be a random variable that represents a magnetic susceptibility (MS) reading for a randomly chosen site on the Hill of Tara. A random sample of 120 sites gave the readings shown in the table below. Magnetic Susceptibility Readings, centimeter-gram-second x 10-6 Magnetic Susceptibility 0 < x < 10 10 < x < 20 20 < x < 30 (cmg x 10-6) Number of Estimated Comment Readings 30 Probability 0.25 "cool" 30/120 54/120 = 0.45 18/120 = 0.15 =…arrow_forward
- #41 asnwer is 17,135.03arrow_forwardA geographer studying West Africa would like to know the size of stones in the delta region where the Niger River runs into the Gulf of Guinea. He collects 53 stones and measures the diameter of each, and so obtains the following measurements, in centimeters as seen below in the frequency table. Size (cm) Frequency [0, 2) [2, 4) 17 13 [4, 6) [6, 8) [8, 10) [10, 12) 10 7 4 a. Create a histogram for the measured stones. Include all labels. b. How many stones are larger than or equal to 6 cm?arrow_forwardPlease see image for Question.arrow_forward
arrow_back_ios
arrow_forward_ios
Recommended textbooks for you
- MATLAB: An Introduction with ApplicationsStatisticsISBN:9781119256830Author:Amos GilatPublisher:John Wiley & Sons Inc
 Probability and Statistics for Engineering and th...StatisticsISBN:9781305251809Author:Jay L. DevorePublisher:Cengage Learning
 Statistics for The Behavioral Sciences (MindTap C...StatisticsISBN:9781305504912Author:Frederick J Gravetter, Larry B. WallnauPublisher:Cengage Learning
  Elementary Statistics: Picturing the World (7th E...StatisticsISBN:9780134683416Author:Ron Larson, Betsy FarberPublisher:PEARSON
 The Basic Practice of StatisticsStatisticsISBN:9781319042578Author:David S. Moore, William I. Notz, Michael A. FlignerPublisher:W. H. Freeman
 Introduction to the Practice of StatisticsStatisticsISBN:9781319013387Author:David S. Moore, George P. McCabe, Bruce A. CraigPublisher:W. H. Freeman
MATLAB: An Introduction with Applications
Statistics
ISBN:9781119256830
Author:Amos Gilat
Publisher:John Wiley & Sons Inc
Probability and Statistics for Engineering and th...
Statistics
ISBN:9781305251809
Author:Jay L. Devore
Publisher:Cengage Learning
Statistics for The Behavioral Sciences (MindTap C...
Statistics
ISBN:9781305504912
Author:Frederick J Gravetter, Larry B. Wallnau
Publisher:Cengage Learning
Elementary Statistics: Picturing the World (7th E...
Statistics
ISBN:9780134683416
Author:Ron Larson, Betsy Farber
Publisher:PEARSON
The Basic Practice of Statistics
Statistics
ISBN:9781319042578
Author:David S. Moore, William I. Notz, Michael A. Fligner
Publisher:W. H. Freeman
Introduction to the Practice of Statistics
Statistics
ISBN:9781319013387
Author:David S. Moore, George P. McCabe, Bruce A. Craig
Publisher:W. H. Freeman