
MATLAB: An Introduction with Applications
6th Edition
ISBN: 9781119256830
Author: Amos Gilat
Publisher: John Wiley & Sons Inc
expand_more
expand_more
format_list_bulleted
Related questions
Question
thumb_up100%
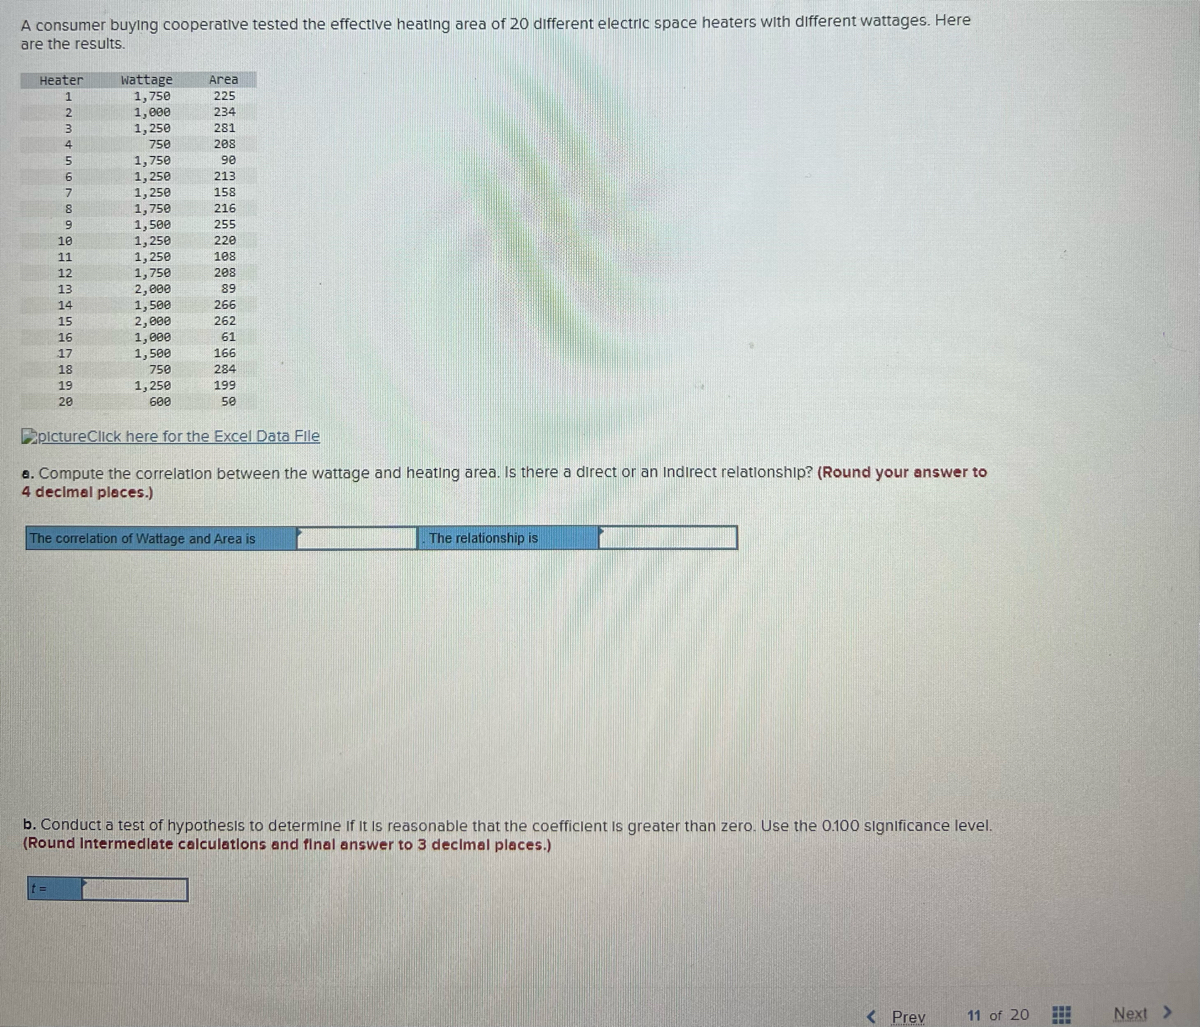

Transcribed Image Text:A consumer buying cooperative tested the effective heating area of 20 different electric space heaters with different wattages. Here
are the results.
Heater
wattage
1,750
1,000
Area
1
225
234
1,250
281
4
750
208
1,750
1, 250
1.258
90
213
7.
1,250
1.758
158
1,750
1.509
216
6.
1,500
1,250
1.250
255
10
220
11
1,250
1750
108
12
1,750
208
13
2,000
1,500
2,000
1,000
1,500
89
14
266
15
262
16
61
17
166
18
750
284
19
1, 250
199
20
600
50
2plctureClick here for the Excel Data File
a. Compute the correlation between the wattage and heating area. Is there a direct or an Indırect relationship? (Round your answer to
4 decimal places.)
The correlation of Wattage and Area is
The relationship is
b. Conduct a test of hypothesis to determine If It is reasonable that the coefficlent Is greater than zero. Use the 0.100 significance level.
(Round Intermedlate calculations and final answer to 3 decimal places.)
t =
< Prev
11 of 20
Next >

Transcribed Image Text:c. Develop the regresslon equation for effective heating based on wattage. (Negatlve value should be Indicated by a minus sign.
Round your answers to 4 decimal places.)
The regression equation is:
d. What heating area corresponds with a 1,500-watt heater? (Round your answers to 4 decimal places.)
Heating area
e. What Is the 95% confidence Interval of heating the area if the wattage Is 1,500? (Round your answers to 4 decimal places.)
Expert Solution
This question has been solved!
Explore an expertly crafted, step-by-step solution for a thorough understanding of key concepts.

This is a popular solution

Trending nowThis is a popular solution!

Step by stepSolved in 4 steps with 3 images

Knowledge Booster

Similar questions
- Consider a two-sided CUSUM chart with k=0.5 and h=5. If the process mean shifts by 1σ, then the approximate ARL1 value of this chart is a. 10.34 b. 9.43 c. 3.94 d. 11.94 e. 4.39arrow_forwardI need help with part b in attached image, please. Thanks.arrow_forwardA mixture of sucrose and water was heated on a hot plate, and the temperature (in °C) was recorded each minute for 20 minutes by three thermocouples. The results are shown in the following table. Time O 1 2 3 4 5 6 7 8 9 71 20 18 29 32 37 36 46 46 56 58 11 10 11231415 167 18 19 20 INR888 gege 64 72 79 84 82 87 98 103 107 103 102 T2 ON 18 22 22 25 37 46 45 44 54 64 69 65 80 74 87 93 90 100 100 103 103 T3 21 11 26 35 33 35 44 43 63 68 62 65 80 75 78 88 91 103 112 107 104 Compute the least-squares line for estimating the temperature as a function of time, using 73 as the value for temperature. (Round the ▼arrow_forward
- I need help with part b pleasearrow_forwardCOMMUNITY PHARMACY 127th St In F of Marle (212) 926-7500 Fax (212) 426-5900 www.harian.com RHOOD PHARMACY m Southern X o Mail-Ald X W W3Scho X W' Exercise X 10 # of movies Frequency 0 1 Twenty-three randomly selected students were asked the number of movies they watched the previous week. The results are as follows. 2 3 4 4 Number of Movies Watched 9 6 3 Welcom 1 NCC-1701 X + V a. Select the correct histogram of the data, where a value is counted in a class interval if it falls on the left boundary, but not if it falls on the right boundary. ☐arrow_forward12arrow_forward
- lustration 13.3. The price quotations for five different commo- dities for 1951 and 1965 are given below. Calculate index number for 1965 with 1951 as base by using the weighted average of price relatives. Commodities 1951 1955 Price per kgm Quantity kgm Price A 6. 50 10 · 2 100 C 4 60 6. 10 30 12 E 8. 40 12arrow_forwardThis set of data provided by Blaisdell (1998) shows the sales of hot, freshly cooked bowls of cereal and the early morning temperature (in degrees Fahrenheit). Calculate and report the three (3) measures of dispersion for the number of hot cereal sales. Temperature Hot Cereal Sales 18 64 10 50 5 80 24 60 38 22 14 72 20 58 32 31 29 54 35 48arrow_forward
arrow_back_ios
arrow_forward_ios
Recommended textbooks for you
- MATLAB: An Introduction with ApplicationsStatisticsISBN:9781119256830Author:Amos GilatPublisher:John Wiley & Sons Inc
 Probability and Statistics for Engineering and th...StatisticsISBN:9781305251809Author:Jay L. DevorePublisher:Cengage Learning
 Statistics for The Behavioral Sciences (MindTap C...StatisticsISBN:9781305504912Author:Frederick J Gravetter, Larry B. WallnauPublisher:Cengage Learning
  Elementary Statistics: Picturing the World (7th E...StatisticsISBN:9780134683416Author:Ron Larson, Betsy FarberPublisher:PEARSON
 The Basic Practice of StatisticsStatisticsISBN:9781319042578Author:David S. Moore, William I. Notz, Michael A. FlignerPublisher:W. H. Freeman
 Introduction to the Practice of StatisticsStatisticsISBN:9781319013387Author:David S. Moore, George P. McCabe, Bruce A. CraigPublisher:W. H. Freeman
MATLAB: An Introduction with Applications
Statistics
ISBN:9781119256830
Author:Amos Gilat
Publisher:John Wiley & Sons Inc
Probability and Statistics for Engineering and th...
Statistics
ISBN:9781305251809
Author:Jay L. Devore
Publisher:Cengage Learning
Statistics for The Behavioral Sciences (MindTap C...
Statistics
ISBN:9781305504912
Author:Frederick J Gravetter, Larry B. Wallnau
Publisher:Cengage Learning
Elementary Statistics: Picturing the World (7th E...
Statistics
ISBN:9780134683416
Author:Ron Larson, Betsy Farber
Publisher:PEARSON
The Basic Practice of Statistics
Statistics
ISBN:9781319042578
Author:David S. Moore, William I. Notz, Michael A. Fligner
Publisher:W. H. Freeman
Introduction to the Practice of Statistics
Statistics
ISBN:9781319013387
Author:David S. Moore, George P. McCabe, Bruce A. Craig
Publisher:W. H. Freeman