
MATLAB: An Introduction with Applications
6th Edition
ISBN: 9781119256830
Author: Amos Gilat
Publisher: John Wiley & Sons Inc
expand_more
expand_more
format_list_bulleted
Related questions
Question
When determining which is significant for part a -make sure to include df, p value (greater than or less than .05), and t statistic
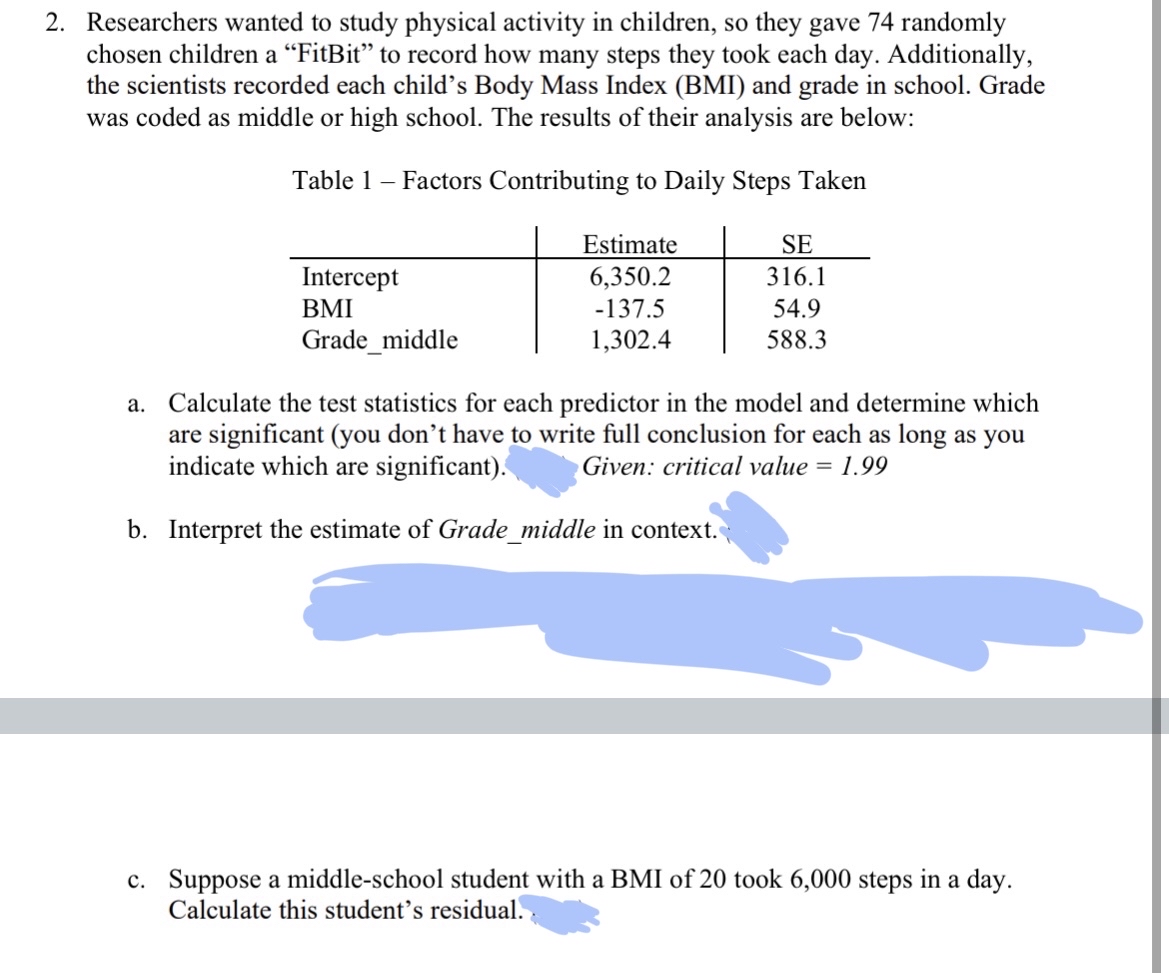

Transcribed Image Text:2. Researchers wanted to study physical activity in children, so they gave 74 randomly
chosen children a "FitBit" to record how many steps they took each day. Additionally,
the scientists recorded each child's Body Mass Index (BMI) and grade in school. Grade
was coded as middle or high school. The results of their analysis are below:
Table 1 - Factors Contributing to Daily Steps Taken
Intercept
BMI
Grade_middle
Estimate
6,350.2
-137.5
1,302.4
SE
316.1
54.9
588.3
a. Calculate the test statistics for each predictor in the model and determine which
are significant (you don't have to write full conclusion for each as long as you
indicate which are significant). Given: critical value = 1.99
b. Interpret the estimate of Grade_middle in context.
c. Suppose a middle-school student with a BMI of 20 took 6,000 steps in a day.
Calculate this student's residual.
Expert Solution
This question has been solved!
Explore an expertly crafted, step-by-step solution for a thorough understanding of key concepts.

Step by stepSolved in 5 steps with 13 images

Knowledge Booster

Similar questions
- Given n = 49, x-bar = 50, s = 7, and H0: µ = 52, what is the computed value for the test statistic? a. -2.00 b. 2.00 c. 1.00 d. -1.00arrow_forwardA magazine used the summated rating of 10 restaurants to predict the cost of a restaurant meal. For that data, SSR = 133,295.11 and SST = 140,966.67. Complete parts (a) through (c). a. Determine the coefficient of determination, r², and interpret its meaning. 2²=(Round to four decimal places as needed.)arrow_forwardCalculate the 25th percentile of the data shown x 1.8 2.3 6.7 11.3 16.7 25.2 26.9 27.9 Is it correct answer 4.5?arrow_forward
- Find the weighted estimate, p, to test the claim that p,arrow_forwardThe percentage of men with cholesterol levels above 220 is closest to…arrow_forwardFind the weighted estimate, p to test the claim that p, = p2. Use a = 0.05. The sample statistics listed below are from independent samples. n1 = 50, x1 = 35, and n2 = 60, x2 = 40 O A. 0.328 O B. 1.367 O C. 0.238 O D. 0.682 Nexarrow_forwardFind the weighted estimate, p to test the claim that p, p2. Use a= 0.02. The sample statistics listed below are from independent samples. n, = 1000, x, = 250, and n, = 1200, x, = 195 3D195 一 O A. 0.789 O B. 0.202 OC. 0.138 O D. 0.110 uc OFarrow_forwardFind t0.69t0.69 for TT distribution with 8282 degrees of freedom. t0.69=t0.69= (Round the answer to 3 decimal places)arrow_forwardGiven SST = 2415, SSE = 1725, n = 7, and k = 2, calculate the value of the overall F test statistic. O Feal = 3.50 O Fcal = 1.25 O Fcal = 0.40 O Fcal = 0.80arrow_forwardWhat are percentiles useful for a. showing frequency b.comparing values c. showing concentrationarrow_forwardThe amount of time a service technician needs to change the oil in a car is uniformly distributed between 11 and 21 minutes. Let X = the time needed to change the oil on a car. c. Find the 50th percentile. Round to the nearest minute.arrow_forwardAn agent for a residential real estate company in a suburb located outside a major city has the business objective of developing more accurate estimates of the monthly rental cost for apartments. Toward the g the agent would like to use the size of an apartment, as defined by square footage to predict the monthly rental cost. The agent selects a sample of 8 one-bedroom apartments and the data are shown. Comple parts (a) through (f). a. Construct a scatter plot. Choose the correct graph below. O A. 2,000 ★Rent ($) → 2,000 Size (sq ft) Q O B. ★Rent ($) 2,000+ to Monthly Rent ($) Size (Square Feet) 0 S 1.₂ 2,000 Size (Sq ft) Q Q □ b. Use the least-squares method to determine the regression coefficients bo and b₁. 900 1,600 825 1,450 1,900 975 1,825 1,300 900 1,200 1,050 1,200 1,900 700 1,350 1,100 bo = (Round to one decimal place as needed.) b₁ = (Round to one decimal place as needed.) c. Interpret the meaning of bo and b₁ in this problem. Choose the correct answer below. (---) O C. 2,000…arrow_forwardarrow_back_iosSEE MORE QUESTIONSarrow_forward_ios
Recommended textbooks for you
- MATLAB: An Introduction with ApplicationsStatisticsISBN:9781119256830Author:Amos GilatPublisher:John Wiley & Sons Inc
 Probability and Statistics for Engineering and th...StatisticsISBN:9781305251809Author:Jay L. DevorePublisher:Cengage Learning
 Statistics for The Behavioral Sciences (MindTap C...StatisticsISBN:9781305504912Author:Frederick J Gravetter, Larry B. WallnauPublisher:Cengage Learning
  Elementary Statistics: Picturing the World (7th E...StatisticsISBN:9780134683416Author:Ron Larson, Betsy FarberPublisher:PEARSON
 The Basic Practice of StatisticsStatisticsISBN:9781319042578Author:David S. Moore, William I. Notz, Michael A. FlignerPublisher:W. H. Freeman
 Introduction to the Practice of StatisticsStatisticsISBN:9781319013387Author:David S. Moore, George P. McCabe, Bruce A. CraigPublisher:W. H. Freeman
MATLAB: An Introduction with Applications
Statistics
ISBN:9781119256830
Author:Amos Gilat
Publisher:John Wiley & Sons Inc
Probability and Statistics for Engineering and th...
Statistics
ISBN:9781305251809
Author:Jay L. Devore
Publisher:Cengage Learning
Statistics for The Behavioral Sciences (MindTap C...
Statistics
ISBN:9781305504912
Author:Frederick J Gravetter, Larry B. Wallnau
Publisher:Cengage Learning
Elementary Statistics: Picturing the World (7th E...
Statistics
ISBN:9780134683416
Author:Ron Larson, Betsy Farber
Publisher:PEARSON
The Basic Practice of Statistics
Statistics
ISBN:9781319042578
Author:David S. Moore, William I. Notz, Michael A. Fligner
Publisher:W. H. Freeman
Introduction to the Practice of Statistics
Statistics
ISBN:9781319013387
Author:David S. Moore, George P. McCabe, Bruce A. Craig
Publisher:W. H. Freeman