MATLAB: An Introduction with Applications
6th Edition
ISBN: 9781119256830
Author: Amos Gilat
Publisher: John Wiley & Sons Inc
expand_more
expand_more
format_list_bulleted
Question

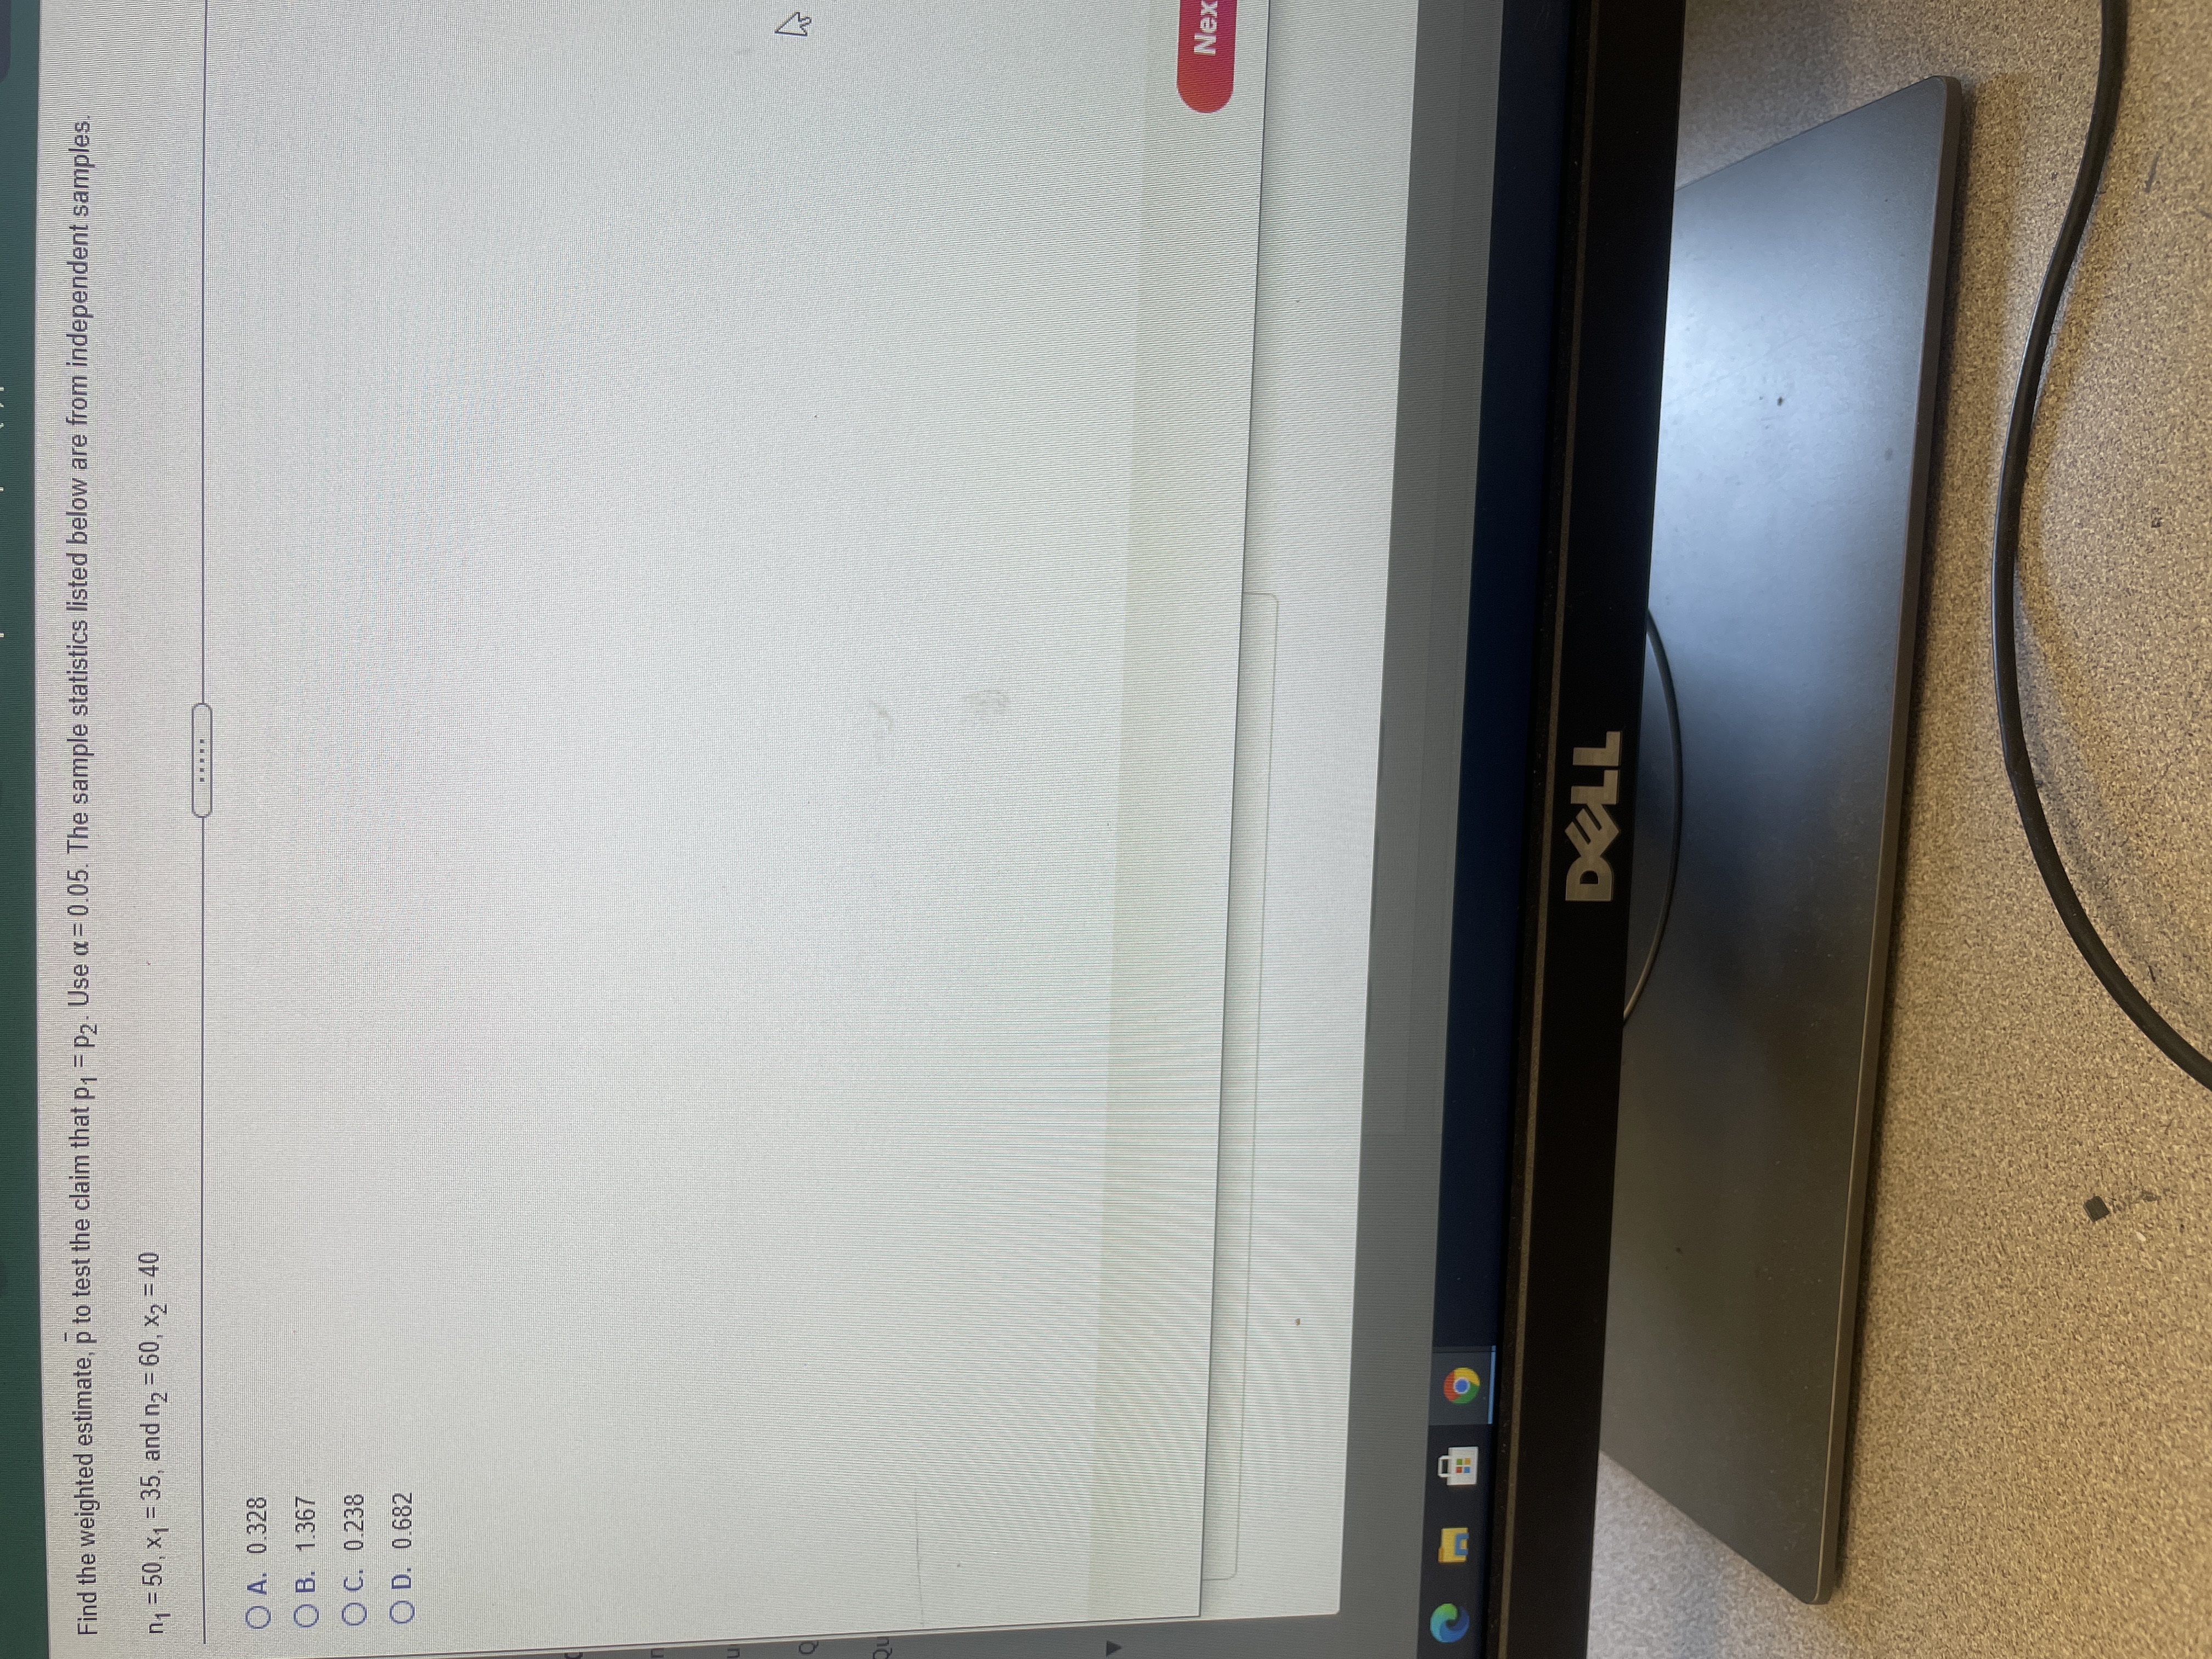
Transcribed Image Text:Find the weighted estimate, p to test the claim that p, = p2. Use a = 0.05. The sample statistics listed below are from independent samples.
n1 = 50, x1 = 35, and n2 = 60, x2 = 40
O A. 0.328
O B. 1.367
O C. 0.238
O D. 0.682
Nex
Expert Solution
This question has been solved!
Explore an expertly crafted, step-by-step solution for a thorough understanding of key concepts.
This is a popular solution
Trending nowThis is a popular solution!
Step by stepSolved in 2 steps with 2 images

Knowledge Booster
Similar questions
- Consider the given data set. n = 7 measurements: 5, 8, 2, 1, 9, 9, 5 Calculate the median. Calculate the upper quartile. Calculate the lower quartile.arrow_forwardAfter students were not doing so well in her math class, Mrs. Stevens decided to try a different approach and use verbal positive reinforcement at least once every hour. Use the following results to find a 95%95% confidence interval for the true mean change in the students’ test scores after Mrs. Stevens started using positive reinforcement. Assume that the population distribution of the paired differences is approximately normally distributed. Round to one decimal place. Students' Test Scores Student Without Reinforcement With Reinforcement 1 6464 8080 2 7373 7474 3 6060 6767 4 6262 8181 5 4848 5050 6 7474 8888arrow_forwardFor the following sample data, find M: 8 , 2, 2, 5, 3.arrow_forward
- determine whether the samples are independent or dependant. To test the effectiveness of a drug, cholesterol level are measured in 60 men and 60 women after the treatment.arrow_forwardCalculate the z score for sales per store x = 45 sales. Use this sample data. 74, 49, 4, 33, 82, 76arrow_forwardA school board would like to determine whether there is a difference in average SAT scores for students at one high school versus another high school in the district. To check, they take a simple random sample of 100 students from each high school. A. Is the data paired?arrow_forward
- 20 computer screens were randomly selected from a large collection of computer screens in a company’s warehouse. These 20 computer screens are referred to as the: test statistic. parameter. population. sample.arrow_forwardConsider a sample with data values of 27, 25, 20, 15, 30, 34, 28, and 25. Compute the 20th, 25th, 60th, and 70th percentiles. If needed, round your answers to two decimal digits.arrow_forwardFind the percentile of the sample data 20 and 37.arrow_forward
- Use the data in the table to the right to answer the following questions. Weights (g) of a Sample Bag of Candy Red Blue Brown Green Yellow 0.964 0.793 0.784 0.814 0.966 0.708 0.991 0.845 0.771 0.733 Find the sample proportion of candy that are red. 0.747 0.886 0.782 0.793 0.882 0.766 0.766 0.919 0.923 0.975 0.849 The proportion of red candy = 0.958 0.762 0.712 0.938 0.752 0.915 (Type an integer or decimal rounded to three decimal places as needed.) 0.822 0.844 0.733 0.781 0.976 0.955 0.827 0.939 0.818 0.805 0.812 0.725 0.966 0.815 0.854 0.915arrow_forwardAssume that you want to test the claim that the paired sample data from a for which the mean difference Ha = 0. Give the value of the ttest statistic. 11 13 5 Y 8 6 4 Note: Use three decimal places.arrow_forwardFind the mean, the median, and the mode(s), if any, for the given data. Round noninteger means to the nearest tenth. (If there is more than one mode, enter your answer as a comma-separated list. If an answer does not exist, enter DNE.) 39, 30, 6, 25, 9, 21, 28, 10 mean medianarrow_forward
arrow_back_ios
SEE MORE QUESTIONS
arrow_forward_ios
Recommended textbooks for you
 MATLAB: An Introduction with ApplicationsStatisticsISBN:9781119256830Author:Amos GilatPublisher:John Wiley & Sons Inc
 Probability and Statistics for Engineering and th...StatisticsISBN:9781305251809Author:Jay L. DevorePublisher:Cengage Learning
 Statistics for The Behavioral Sciences (MindTap C...StatisticsISBN:9781305504912Author:Frederick J Gravetter, Larry B. WallnauPublisher:Cengage Learning
 Elementary Statistics: Picturing the World (7th E...StatisticsISBN:9780134683416Author:Ron Larson, Betsy FarberPublisher:PEARSON
 The Basic Practice of StatisticsStatisticsISBN:9781319042578Author:David S. Moore, William I. Notz, Michael A. FlignerPublisher:W. H. Freeman
 Introduction to the Practice of StatisticsStatisticsISBN:9781319013387Author:David S. Moore, George P. McCabe, Bruce A. CraigPublisher:W. H. Freeman

MATLAB: An Introduction with Applications
Statistics
ISBN:9781119256830
Author:Amos Gilat
Publisher:John Wiley & Sons Inc

Probability and Statistics for Engineering and th...
Statistics
ISBN:9781305251809
Author:Jay L. Devore
Publisher:Cengage Learning

Statistics for The Behavioral Sciences (MindTap C...
Statistics
ISBN:9781305504912
Author:Frederick J Gravetter, Larry B. Wallnau
Publisher:Cengage Learning

Elementary Statistics: Picturing the World (7th E...
Statistics
ISBN:9780134683416
Author:Ron Larson, Betsy Farber
Publisher:PEARSON

The Basic Practice of Statistics
Statistics
ISBN:9781319042578
Author:David S. Moore, William I. Notz, Michael A. Fligner
Publisher:W. H. Freeman

Introduction to the Practice of Statistics
Statistics
ISBN:9781319013387
Author:David S. Moore, George P. McCabe, Bruce A. Craig
Publisher:W. H. Freeman