MATLAB: An Introduction with Applications
6th Edition
ISBN: 9781119256830
Author: Amos Gilat
Publisher: John Wiley & Sons Inc
expand_more
expand_more
format_list_bulleted
Question

Transcribed Image Text:10:16 PM Thu May 18
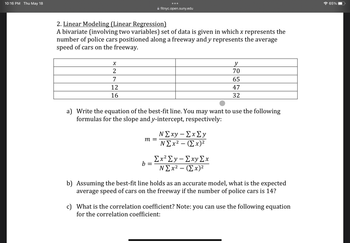
X
2
2. Linear Modeling (Linear Regression)
A bivariate (involving two variables) set of data is given in which x represents the
number of police cars positioned along a freeway and y represents the average
speed of cars on the freeway.
7
12
16
●●●
m =
fitnyc.open.suny.edu
b =
a) Write the equation of the best-fit line. You may want to use the following
formulas for the slope and y-intercept, respectively:
N Σxy - Σx Σy
N Σx2 – (Σx)2
y
70
65
47
32
Ex² Ey-Exy Ex
N Σx2 – (Σx)2
b) Assuming the best-fit line holds as an accurate model, what is the expected
average speed of cars on the freeway if the number of police cars is 14?
c) What is the correlation coefficient? Note: you can use the following equation
for the correlation coefficient:
65%

Transcribed Image Text:10:16 PM Thu May 18
2 of 2
●●●
fitnyc.open.suny.edu
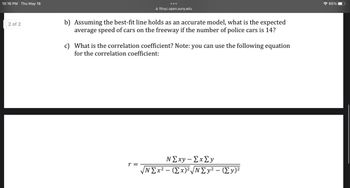
b) Assuming the best-fit line holds as an accurate model, what is the expected
average speed of cars on the freeway if the number of police cars is 14?
r =
c) What is the correlation coefficient? Note: you can use the following equation
for the correlation coefficient:
N Σxy - Σx ΣΥ
N Σx2 - (Σx)|N Σy2 - (Σy)2
☎ 65%
Expert Solution
This question has been solved!
Explore an expertly crafted, step-by-step solution for a thorough understanding of key concepts.
Step by stepSolved in 4 steps

Knowledge Booster
Similar questions
- answer using minitab or excelarrow_forwardq4. Linear regressionarrow_forwardThe temperature of a liquid during the first four minutes of an experiment has been recorded in the table below. Time (x) (minutes) 0 1 2 3 4 Temperature (y) (°C) 30 33 40 56 73 Determine if the relationship between temperature and time is linear by constructing a residual plot.arrow_forward
- Regression methods were used to analyze the data from a study investigating the relationship between roadway surface temperature (x) and pavement deflection (y). The simple linear regression model is y = 0.33 + 0.0042x. (a) Suppose that temperature is measured in °C rather than °F. Determine regression coefficients for the new model y = Bo +B1x. Round your answer to two decimal places (e.g. 98.76). Bo Round your answer to four decimal places (e.g. 98.7654). (b) What change in expected pavement deflection is associated with a 1°C change in surface temperature? Round your answer to four decimal places (e.g. 98.7654). Save for Later Attempts: 0 of 1 used Submit Answerarrow_forwardLean body mass (weight leaving out fat ) helps predict metabolic rate (how many calories of energy are burned in a hour ) The relationship is roughly a straight line the least squares regression line for predicting metabolic rate (y in calories) from lean body mass (x in kilograms) is y =113.2+26.9x The slope of regression line is ?arrow_forwardStatistics - Regression Analysisarrow_forward
- Statistics professor wants to use the number of hours (x) a student studies for a statistics final exam to predict the final exam score (y). A regression model was fit based on data collected from a class during the previous semester, with the following results: (y hat): y = 35.0 + 3X 1. What is the y-intercept? 2. What is the slope? 3. If the student spends 2 hours studying, what could be his/her final exam score? 4. If the student spends 2 hours studying, what could be his/her final exam score?5. If the student does not study for the final exam, what is the predicted final exam score?arrow_forwardHow much should a healthy Shetland pony weigh? Let x be the age of the pony (in months), and let y be the average weight of the pony (in kilograms). x 3 6 12 20 26 y 60 95 140 160 189 (a) Make a scatter diagram of the data and visualize the line you think best fits the data. Flash Player version 10 or higher is required for this question. You can get Flash Player free from Adobe's website. (b) Would you say the correlation is low, moderate, or strong? low moderate strong Would you say the correlation is positive or negative? positive negative (c) Use a calculator to verify that x = 67, x2 = 1265, y = 644, y2 = 93,546, and xy = 10,544. Compute r. (Round your answer to three decimal places.) As x increases from 3 to 26 months, does the value of r imply that y should tend to increase or decrease? Explain your answer. Given our value of r, y should…arrow_forwardEQuestion Help Find the equation of the regression line for the given data. Then construct a scatter plot of the data and draw the regression line. (The pair of variables have a significant correlation) Then use the regression equation to predict the value of y for each of the given x-values, if meaningful. The number of hours 6 students spent for a test and their scores on that test are shown below. Hours spent studying, x IA Test score,y 3 (a) x=2 hours (c) x= 12 hours (b) x = 25 hours (d) x= 4.5 hours 38 44 50 47 61 68 Find the regression equation. y = 6.269 x+ (32.48) (Round the slope to three decimal places as needed. Round the y-intercept to two decimal places as needed.) Choose the correct graph below. OD. OB. OC. O A. 80- 80- 80 80-4 0-+ Hours studying Hours studying Hours studying Hours studying 10 18 PM (E) More 10/3/2020 Click to select your answer(s)arrow_forward
arrow_back_ios
SEE MORE QUESTIONS
arrow_forward_ios
Recommended textbooks for you
 MATLAB: An Introduction with ApplicationsStatisticsISBN:9781119256830Author:Amos GilatPublisher:John Wiley & Sons Inc
 Probability and Statistics for Engineering and th...StatisticsISBN:9781305251809Author:Jay L. DevorePublisher:Cengage Learning
 Statistics for The Behavioral Sciences (MindTap C...StatisticsISBN:9781305504912Author:Frederick J Gravetter, Larry B. WallnauPublisher:Cengage Learning
 Elementary Statistics: Picturing the World (7th E...StatisticsISBN:9780134683416Author:Ron Larson, Betsy FarberPublisher:PEARSON
 The Basic Practice of StatisticsStatisticsISBN:9781319042578Author:David S. Moore, William I. Notz, Michael A. FlignerPublisher:W. H. Freeman
 Introduction to the Practice of StatisticsStatisticsISBN:9781319013387Author:David S. Moore, George P. McCabe, Bruce A. CraigPublisher:W. H. Freeman

MATLAB: An Introduction with Applications
Statistics
ISBN:9781119256830
Author:Amos Gilat
Publisher:John Wiley & Sons Inc

Probability and Statistics for Engineering and th...
Statistics
ISBN:9781305251809
Author:Jay L. Devore
Publisher:Cengage Learning

Statistics for The Behavioral Sciences (MindTap C...
Statistics
ISBN:9781305504912
Author:Frederick J Gravetter, Larry B. Wallnau
Publisher:Cengage Learning

Elementary Statistics: Picturing the World (7th E...
Statistics
ISBN:9780134683416
Author:Ron Larson, Betsy Farber
Publisher:PEARSON

The Basic Practice of Statistics
Statistics
ISBN:9781319042578
Author:David S. Moore, William I. Notz, Michael A. Fligner
Publisher:W. H. Freeman

Introduction to the Practice of Statistics
Statistics
ISBN:9781319013387
Author:David S. Moore, George P. McCabe, Bruce A. Craig
Publisher:W. H. Freeman