
MATLAB: An Introduction with Applications
6th Edition
ISBN: 9781119256830
Author: Amos Gilat
Publisher: John Wiley & Sons Inc
expand_more
expand_more
format_list_bulleted
Related questions
Question
please solve use regression .
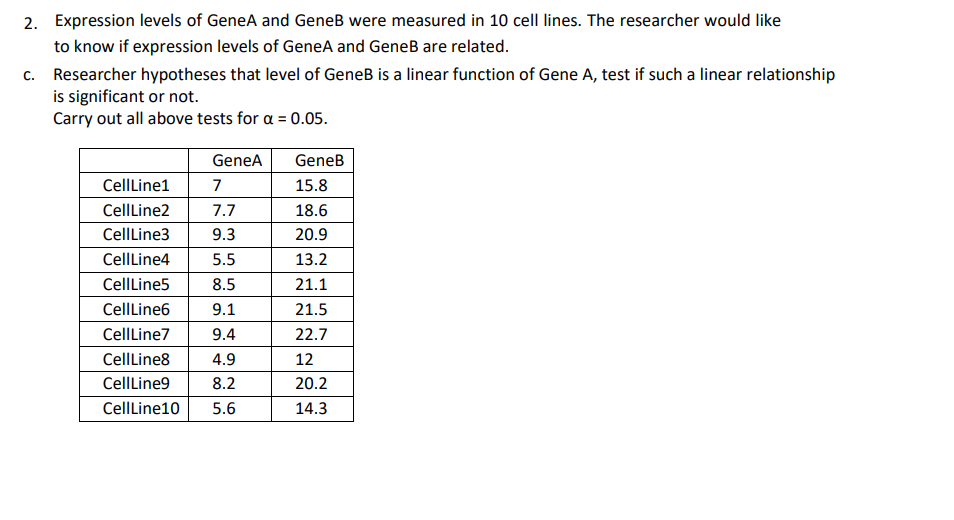

Transcribed Image Text:2. Expression levels of GeneA and GeneB were measured in 10 cell lines. The researcher would like
to know if expression levels of GeneA and GeneB are related.
c. Researcher hypotheses that level of GeneB is a linear function of Gene A, test if such a linear relationship
is significant or not.
Carry out all above tests for a = 0.05.
GeneA
GeneB
CellLine1
7
15.8
CellLine2
7.7
18.6
CellLine3
9.3
20.9
CellLine4
5.5
13.2
CellLine5
8.5
21.1
CellLine6
9.1
21.5
CellLine7
9.4
22.7
CellLine8
4.9
12
CellLine9
8.2
20.2
CellLine10
5.6
14.3
Expert Solution
This question has been solved!
Explore an expertly crafted, step-by-step solution for a thorough understanding of key concepts.

Step by stepSolved in 3 steps with 1 images

Knowledge Booster


Learn more about
Need a deep-dive on the concept behind this application? Look no further. Learn more about this topic, statistics and related others by exploring similar questions and additional content below.Similar questions
- Interpret an R^2 value of 0.62 for a linear regression model where X is the independent variable and Y is the dependent variable.arrow_forwardWhat is the slope and intercept for the regression equation given this data? X = 72, 81, 54, 50, -3 Y = 69, 97, 73, 22, -10 Please format to 2 decimal places.arrow_forwardWrite a multiple regression equation that can be used to analyze the data for a two-factorialdesign with two levels for factor A and three levels for factor B. Define all variables.arrow_forward
- The CDC released the following table of life expectancies for Americans from 1900-2010. Year 1900 1910 1920 1930 1940 1950 1960 1970 1980 1990 2000 2010 Life Expectancy 47.3 50.0 54.1 59.7 62.9 68.2 69.7 70.8 73.7 75.4 76.8 78.7 It is believed that there is a logarithmic relation between life expectancy and the year. Transform the data correctly to perform a linear least squares regression, then report your model as y=mlnx+by=mlnx+b. Estimate the year when life expectancy should be 82.arrow_forwardAy -5arrow_forwardNeed help If my outer regression equation is Weight= -191.891 + 5.06 (Height) How do I find the estimated weight LBS for an individual with height 76 inches?arrow_forward
- The equation used to predict annual cauliflower yield (in pounds per acre) is y=24,596+4.423x1−4.772x2, where x1 is the number of acres planted an x2 is the number of acres harvested. Use the multiple regression equation to predict the y-values for the values of the independent variables.arrow_forwardSuppose that the regression equation that estimates the value of a car (in dollars) based on its age (in years) is given by: Predicted Value = 21375 - 1215 Age. You have an 8-year old car. How much is it worth?arrow_forwardA business statistics professor would like to develop a regression model to predict the exam scores for students based on their current GPAs, the number of hours they studied for the exam, and the number of times they were absent during the semester. The data for these variables can be found in this file. a) Run the multiple regression in Excel. Hint: set x1 = GPA, x2 = Hours, X3 = Absences. b) Find the R2 and explain its meaning. c) Explain the outcome of the F test. What does it mean? d) Explain the outcomes of the t tests for the slope coefficients. e) Write out the regression equation. f) Explain the meanings of the slope coefficients.arrow_forward
- You run a linear regression to predict BMI (body mass index) from average minutes of physical activity per day. You calculate the slope of the regression to be -.054. Interpret the slope in terms of the independent and dependent variables.arrow_forwardWhat are some ideas for practice problems that use the regression equation?arrow_forwardThe number of hours 13 students spent studying for an exam and their scores on that test are described by the regression equation ŷ = 7.350x + 34.617. What is the predicted score if the student spent 4.5 hours studying?arrow_forward
arrow_back_ios
SEE MORE QUESTIONS
arrow_forward_ios
Recommended textbooks for you
- MATLAB: An Introduction with ApplicationsStatisticsISBN:9781119256830Author:Amos GilatPublisher:John Wiley & Sons Inc
 Probability and Statistics for Engineering and th...StatisticsISBN:9781305251809Author:Jay L. DevorePublisher:Cengage Learning
 Statistics for The Behavioral Sciences (MindTap C...StatisticsISBN:9781305504912Author:Frederick J Gravetter, Larry B. WallnauPublisher:Cengage Learning
  Elementary Statistics: Picturing the World (7th E...StatisticsISBN:9780134683416Author:Ron Larson, Betsy FarberPublisher:PEARSON
 The Basic Practice of StatisticsStatisticsISBN:9781319042578Author:David S. Moore, William I. Notz, Michael A. FlignerPublisher:W. H. Freeman
 Introduction to the Practice of StatisticsStatisticsISBN:9781319013387Author:David S. Moore, George P. McCabe, Bruce A. CraigPublisher:W. H. Freeman
MATLAB: An Introduction with Applications
Statistics
ISBN:9781119256830
Author:Amos Gilat
Publisher:John Wiley & Sons Inc
Probability and Statistics for Engineering and th...
Statistics
ISBN:9781305251809
Author:Jay L. Devore
Publisher:Cengage Learning
Statistics for The Behavioral Sciences (MindTap C...
Statistics
ISBN:9781305504912
Author:Frederick J Gravetter, Larry B. Wallnau
Publisher:Cengage Learning
Elementary Statistics: Picturing the World (7th E...
Statistics
ISBN:9780134683416
Author:Ron Larson, Betsy Farber
Publisher:PEARSON
The Basic Practice of Statistics
Statistics
ISBN:9781319042578
Author:David S. Moore, William I. Notz, Michael A. Fligner
Publisher:W. H. Freeman
Introduction to the Practice of Statistics
Statistics
ISBN:9781319013387
Author:David S. Moore, George P. McCabe, Bruce A. Craig
Publisher:W. H. Freeman