MATLAB: An Introduction with Applications
6th Edition
ISBN: 9781119256830
Author: Amos Gilat
Publisher: John Wiley & Sons Inc
expand_more
expand_more
format_list_bulleted
Concept explainers
Question
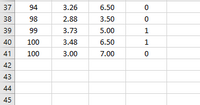
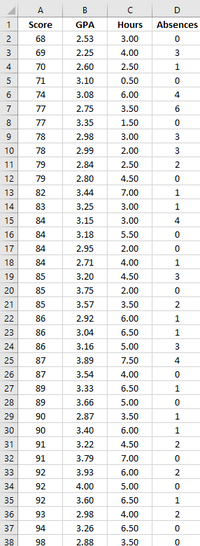
A business statistics professor would like to develop a regression model to predict the exam scores for students based on their current GPAs, the number of hours they studied for the exam, and the number of times they were absent during the semester. The data for these variables can be found in this file.
a) Run the multiple regression in Excel. Hint: set x1 = GPA, x2 = Hours, X3 = Absences.
b) Find the R2 and explain its meaning.
c) Explain the outcome of the F test. What does it mean?
d) Explain the outcomes of the t tests for the slope coefficients.
e) Write out the regression equation.
f) Explain the meanings of the slope coefficients.

Transcribed Image Text:37
94
3.26
6.50
38
98
2.88
3.50
39
99
3.73
5.00
1
40
100
3.48
6.50
1
41
100
3.00
7.00
42
43
44
45

Transcribed Image Text:A
В
D
1
Score
GPA
Hours
Absences
2
68
2.53
3.00
3
69
2.25
4.00
3
4
70
2.60
2.50
1.
71
3.10
0.50
6.
74
3.08
6.00
4
7
77
2.75
3.50
8
77
3.35
1.50
9
78
2.98
3.00
3
10
78
2.99
2.00
3
11
79
2.84
2.50
12
79
2.80
4.50
13
82
3.44
7.00
1
14
83
3.25
3.00
15
84
3.15
3.00
16
84
3.18
5.50
17
84
2.95
2.00
18
84
2.71
4.00
19
85
3.20
4.50
3
20
85
3.75
2.00
21
85
3.57
3.50
2
22
86
2.92
6.00
1.
23
86
3.04
6.50
1.
24
86
3.16
5.00
25
87
3.89
7.50
4
26
87
3.54
4.00
27
89
3.33
6.50
1.
28
89
3.66
5.00
29
90
2.87
3.50
1.
30
90
3.40
6.00
1.
31
91
3.22
4.50
2.
32
91
3.79
7.00
33
92
3.93
6.00
2
34
92
4.00
5.00
35
92
3.60
6.50
36
93
2.98
4.00
2
37
94
3.26
6.50
38
98
2.88
3.50
2.
C.
Expert Solution
This question has been solved!
Explore an expertly crafted, step-by-step solution for a thorough understanding of key concepts.
This is a popular solution
Trending nowThis is a popular solution!
Step by stepSolved in 2 steps with 1 images

Knowledge Booster
Learn more about
Need a deep-dive on the concept behind this application? Look no further. Learn more about this topic, statistics and related others by exploring similar questions and additional content below.Similar questions
- The number of megapixels in a digital camera is one of the most important factors in determining picture quality. But, do digital cameras with more megapixels cost more? The following data show the number of megapixels and the price ($) for 10 digital cameras(Consumer Reports, March 2009). Use these data to develop an estimated regression equation that can be used to predict the price of a digital camera given the number of megapixels. Brand and Model Megapixels Price (S) Canon PowerShot SD1100 IS Casio Exilim Card EX-510 8 180 200 230 10 Sony Cyber-shot DSC-T70 Pentax Optio M50 Canon PowerShot G10 120 470 15 8 Canon PowerShot A590 IS Canon PowerShot El 140 180 10 12 Fujifilm FinePix FOOFD Sony Cyber-shot DSC-W170 Canon PowerShot A470 310 10 250 110arrow_forwardWrite a short note on regression analysisarrow_forwardPlease answer parts d, e and f.arrow_forward
- Researchers are interested in predicting the height of a child based on the heights of their mother and father. Data were collected, which included height of the child ( height), height of the mother ( mothersheight ), and height of the father (fathersheight ). The initial analysis used the heights of the parents to predict the height of the child (all units are inches). The results of the analysis, a multiple regression, are presented below. . regress height mothersheight fathersheight Source Model Residual Total height mothersheight fathersheight _cons SS 208.008457 314.295372 522.303829 df 2 104.004228 8.49446952 37 MS 39 13.3924059 Coef. Std. Err. .6579529 .1474763 .2003584 .1382237 9.804327 12.39987 t P>|t| 4.46 0.000 C 0.156 0.79 0.434 Number of obs = F( 2, 37) = Prob > F R-squared Adj R-squared = Root MSE = = .3591375 -.0797093 -15.32021 = 40 12.24 0.0001 0.3983 0.3657 2.9145 [95% Conf. Interval] .9567683 .4804261 34.92886 What are the null and alternative hypotheses…arrow_forwardThe file Galton on D2L contains the 928 observations Francis Galton used in 1885 to estimate the relationship between the heights of parents and the heights of their children. The column Children refers to the height (in inches) of a child, and the column Mid-Parents refers to the average height (in inches) of the mother and father of that child. You can download this file into Excel and Minitab. a. Calculate the regression Height of Children = a +b (Height of Mid-Parents). b. Calculate the average for Height of Children, and calculate the average Height of Mid-Parents. c. Create a new variable in Minitab which is the Height of Children measured in terms of deviations from its mean. Call this new variable y. Also, create a new variable in Minitab with is the Height of Mid-Parents measured in terms of deviations from its mean. Call this new variable x. Calculate the regression y = a + bx. You can create the new y and x variables in Excel of Minitab, whichever you find more convenient.…arrow_forwardThe datasetBody.xlsgives the percent of weight made up of body fat for 100 men as well as other variables such as Age, Weight (lb), Height (in), and circumference (cm) measurements for the Neck, Chest, Abdomen, Ankle, Biceps, and Wrist. We are interested in predicting body fat based on abdomen circumference. Find the equation of the regression line relating to body fat and abdomen circumference. Make a scatter-plot with a regression line. What body fat percent does the line predict for a person with an abdomen circumference of 110 cm? One of the men in the study had an abdomen circumference of 92.4 cm and a body fat of 22.5 percent. Find the residual that corresponds to this observation. Bodyfat Abdomen 32.3 115.6 22.5 92.4 22 86 12.3 85.2 20.5 95.6 22.6 100 28.7 103.1 21.3 89.6 29.9 110.3 21.3 100.5 29.9 100.5 20.4 98.9 16.9 90.3 14.7 83.3 10.8 73.7 26.7 94.9 11.3 86.7 18.1 87.5 8.8 82.8 11.8 83.3 11 83.6 14.9 87 31.9 108.5 17.3…arrow_forward
- A biologist wants to predict the height of male giraffes, y, in feet, given their age, x1, in years, weight, x2, in pounds, and neck length, x3, in feet. She obtains the multiple regression equation yˆ=7.36+0.00895x1+0.000426x2+0.913x3. Predict the height of a 12-year-old giraffe that weighs 3,100 pounds and has a 7-foot-long neck, rounding to the nearest foot.arrow_forwardWould the regression in Equation be useful for predicting test scoresin a school district in Massachusetts? Why or why not?arrow_forwardAn admissions counselor is looking to determine an equation that relates the graduate grade point averages of students who are newly admitted to an academic program with their undergraduate GPA, their GRE scores, and the number of years they have been out of college. What is the correct format for a multiple regression equation? Select the correct answer below: yˆ=b0+b1x1+b2x2+b3x3 yˆ=b1x1+b2x2+b3x3 yˆ=b0+b1x1+b2x2+b3x3+b4x4 yˆ=b0+b1x1+b2x2arrow_forward
- The U.S. Postal Service is attempting to reduce the number of complaints made by the public against its workers. To facilitate this task, a staff analyst for the service regresses the number of complaints lodged against an employee last year on the hourly wage of the employee for the year. The analyst ran a simple linear regression in SPSS. The results are shown below. The current minimum wage is $5.15. If an employee earns the minimum wage, how many complaints can that employee expect to receive? Is the regression coefficient statistically significant? How can you tell?arrow_forwardResearchers are interested in predicting the height of a child based on the heights of their mother and father. Data were collected, which included height of the child (height ), height of the mother ( mothersheight), and height of the father (fathersheight ). The initial analysis used the heights of the parents to predict the height of the child (all units are inches). The results of the analysis, a multiple regression, are presented below. . regress height mothersheight fathersheight Source Model Residual Total height mothersheight fathersheight _cons SS df 208.008457 314.295372 37 2 104.004228 8.49446952 MS 522.303829 39 13.3924059 Coef. Std. Err. .6579529 .1474763 .2003584 .1382237 9.804327 12.39987 t P>|t| 4.46 0.000 C 0.156 0.79 0.434 Number of obs = F( 2, 37) = Prob > F R-squared Adj R-squared Root MSE = .3591375 -.0797093 -15.32021 = 40 12.24 0.0001 0.3983 0.3657 2.9145 [95% Conf. Interval] .9567683 .4804261 34.92886 What is the predicted height for a child born to a mother…arrow_forwardA student used multiple regression analysis to study how family spending (y) is influenced by income (X1), family size (x2), and additions to savings (x3). The variables y, x1, and x3 are measured in thousands of dollars. The following results were obtained.arrow_forward
arrow_back_ios
SEE MORE QUESTIONS
arrow_forward_ios
Recommended textbooks for you
 MATLAB: An Introduction with ApplicationsStatisticsISBN:9781119256830Author:Amos GilatPublisher:John Wiley & Sons Inc
 Probability and Statistics for Engineering and th...StatisticsISBN:9781305251809Author:Jay L. DevorePublisher:Cengage Learning
 Statistics for The Behavioral Sciences (MindTap C...StatisticsISBN:9781305504912Author:Frederick J Gravetter, Larry B. WallnauPublisher:Cengage Learning
 Elementary Statistics: Picturing the World (7th E...StatisticsISBN:9780134683416Author:Ron Larson, Betsy FarberPublisher:PEARSON
 The Basic Practice of StatisticsStatisticsISBN:9781319042578Author:David S. Moore, William I. Notz, Michael A. FlignerPublisher:W. H. Freeman
 Introduction to the Practice of StatisticsStatisticsISBN:9781319013387Author:David S. Moore, George P. McCabe, Bruce A. CraigPublisher:W. H. Freeman

MATLAB: An Introduction with Applications
Statistics
ISBN:9781119256830
Author:Amos Gilat
Publisher:John Wiley & Sons Inc

Probability and Statistics for Engineering and th...
Statistics
ISBN:9781305251809
Author:Jay L. Devore
Publisher:Cengage Learning

Statistics for The Behavioral Sciences (MindTap C...
Statistics
ISBN:9781305504912
Author:Frederick J Gravetter, Larry B. Wallnau
Publisher:Cengage Learning

Elementary Statistics: Picturing the World (7th E...
Statistics
ISBN:9780134683416
Author:Ron Larson, Betsy Farber
Publisher:PEARSON

The Basic Practice of Statistics
Statistics
ISBN:9781319042578
Author:David S. Moore, William I. Notz, Michael A. Fligner
Publisher:W. H. Freeman

Introduction to the Practice of Statistics
Statistics
ISBN:9781319013387
Author:David S. Moore, George P. McCabe, Bruce A. Craig
Publisher:W. H. Freeman