
MATLAB: An Introduction with Applications
6th Edition
ISBN: 9781119256830
Author: Amos Gilat
Publisher: John Wiley & Sons Inc
expand_more
expand_more
format_list_bulleted
Related questions
Question
Please help ()()()
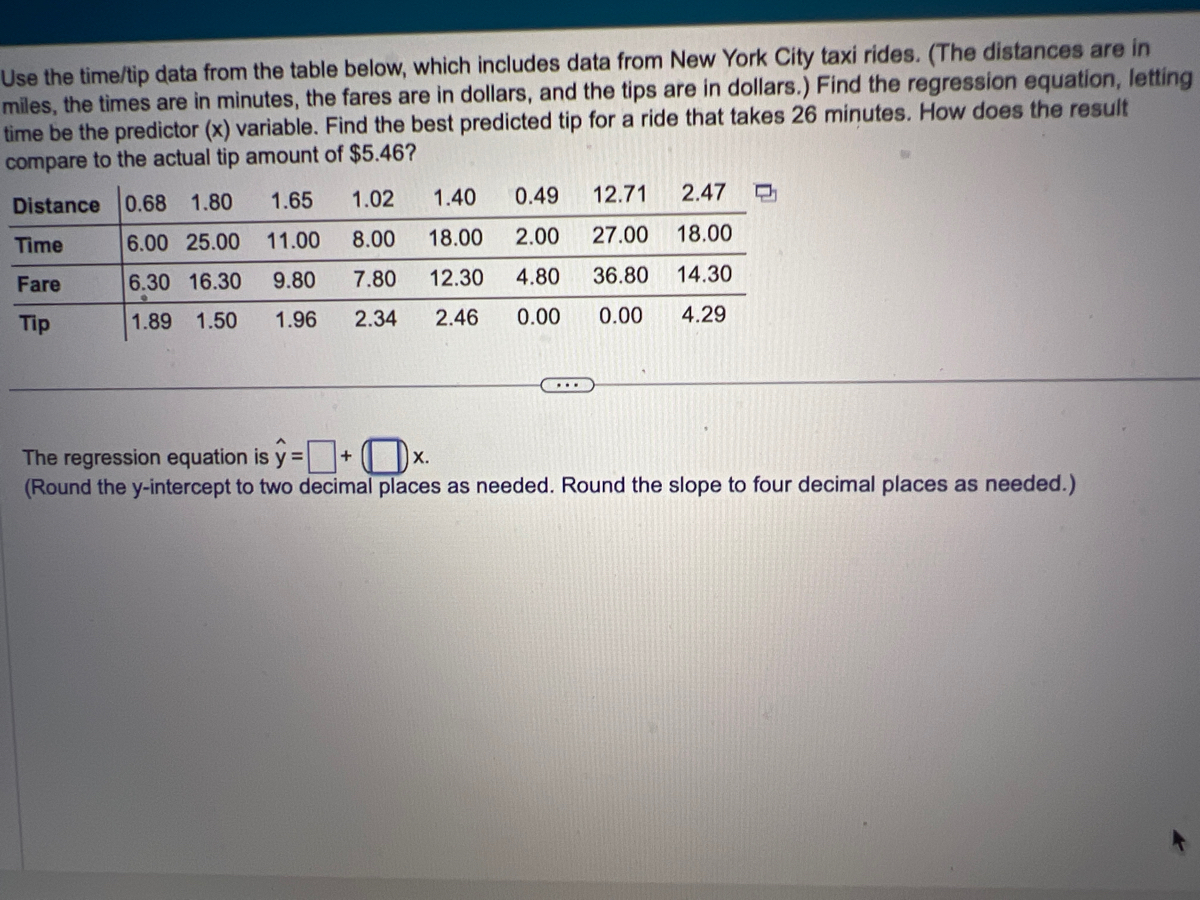

Transcribed Image Text:Use the time/tip data from the table below, which includes data from New York City taxi rides. (The distances are in
miles, the times are in minutes, the fares are in dollars, and the tips are in dollars.) Find the regression equation, letting
time be the predictor (x) variable. Find the best predicted tip for a ride that takes 26 minutes. How does the result
compare to the actual tip amount of $5.46?
Distance 0.68 1.80
6.00 25.00
6.30 16.30
9.80
1.89 1.50 1.96
Time
Fare
Tip
1.65
11.00
1.02
1.40
0.49
12.71 2.47
8.00 18.00
2.00 27.00 18.00
7.80 12.30
4.80 36.80
14.30
2.34 2.46 0.00 0.00
4.29
D
The regression equation is y=[ +
(Round the y-intercept to two decimal places as needed. Round the slope to four decimal places as needed.)
Expert Solution
This question has been solved!
Explore an expertly crafted, step-by-step solution for a thorough understanding of key concepts.

This is a popular solution

Trending nowThis is a popular solution!

Step by stepSolved in 4 steps

Knowledge Booster

Similar questions
- Let f(x)=x²-9x +4. Find f(-1). f(-1) = 106 19,758 NOV 30arrow_forwardLet f = {(1, 2), (3, 4), (2, 6), (5, 9}. Find the domain of farrow_forwardIdentify the inner and outer functions in the composition (6x? +7) * Let f(u) represent the outer function and g(x) represent the inner function.arrow_forward
arrow_back_ios
arrow_forward_ios
Recommended textbooks for you
- MATLAB: An Introduction with ApplicationsStatisticsISBN:9781119256830Author:Amos GilatPublisher:John Wiley & Sons Inc
 Probability and Statistics for Engineering and th...StatisticsISBN:9781305251809Author:Jay L. DevorePublisher:Cengage Learning
 Statistics for The Behavioral Sciences (MindTap C...StatisticsISBN:9781305504912Author:Frederick J Gravetter, Larry B. WallnauPublisher:Cengage Learning
  Elementary Statistics: Picturing the World (7th E...StatisticsISBN:9780134683416Author:Ron Larson, Betsy FarberPublisher:PEARSON
 The Basic Practice of StatisticsStatisticsISBN:9781319042578Author:David S. Moore, William I. Notz, Michael A. FlignerPublisher:W. H. Freeman
 Introduction to the Practice of StatisticsStatisticsISBN:9781319013387Author:David S. Moore, George P. McCabe, Bruce A. CraigPublisher:W. H. Freeman
MATLAB: An Introduction with Applications
Statistics
ISBN:9781119256830
Author:Amos Gilat
Publisher:John Wiley & Sons Inc
Probability and Statistics for Engineering and th...
Statistics
ISBN:9781305251809
Author:Jay L. Devore
Publisher:Cengage Learning
Statistics for The Behavioral Sciences (MindTap C...
Statistics
ISBN:9781305504912
Author:Frederick J Gravetter, Larry B. Wallnau
Publisher:Cengage Learning
Elementary Statistics: Picturing the World (7th E...
Statistics
ISBN:9780134683416
Author:Ron Larson, Betsy Farber
Publisher:PEARSON
The Basic Practice of Statistics
Statistics
ISBN:9781319042578
Author:David S. Moore, William I. Notz, Michael A. Fligner
Publisher:W. H. Freeman
Introduction to the Practice of Statistics
Statistics
ISBN:9781319013387
Author:David S. Moore, George P. McCabe, Bruce A. Craig
Publisher:W. H. Freeman