
MATLAB: An Introduction with Applications
6th Edition
ISBN: 9781119256830
Author: Amos Gilat
Publisher: John Wiley & Sons Inc
expand_more
expand_more
format_list_bulleted
Related questions
Concept explainers
Topic Video
Question
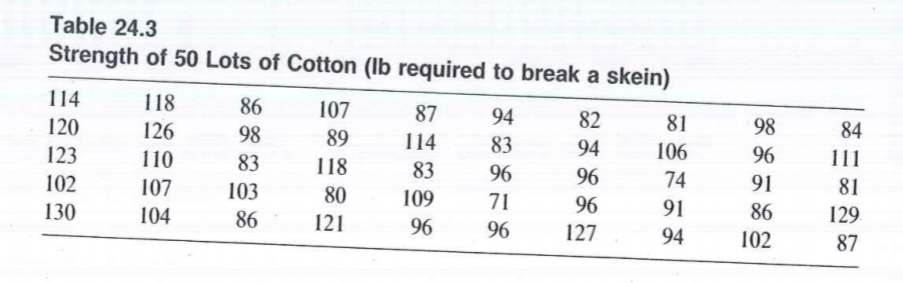

Transcribed Image Text:Table 24.3
Strength of 50 Lots of Cotton (Ib required to break a skein)
114
118
86
107
87
94
82
81
120
126
98
89
98
84
123
114
83
94
106
96
110
83
118
83
111
102
107
96
96
74
91
81
103
80
109
71
96
130
104
86
91
86
129
121
96
96
127
94
102
87

Transcribed Image Text:16. The percentiles Q25 and Qr5 of a sample are called the lower and upper quartiles
of the sample, and Q75
interquartile range. Find Q25, Q5, and Q75 - Q2, for the sample in Table 24.2.
Q25, which is a measure for the spread, is called the
25
15 ond 16 for the cample in Table 24 3
in Drohe
Expert Solution
This question has been solved!
Explore an expertly crafted, step-by-step solution for a thorough understanding of key concepts.

This is a popular solution

Trending nowThis is a popular solution!

Step by stepSolved in 2 steps

Knowledge Booster


Learn more about
Need a deep-dive on the concept behind this application? Look no further. Learn more about this topic, statistics and related others by exploring similar questions and additional content below.Similar questions
- A traffic safety company publishes reports about motorcycle fatalities and helmet use. In the first accompanying data table, the distribution shows the proportion of fatalities by location of injury for motorcycle accidents. The second data table shows the location of injury and fatalities for 2061 riders not wearing a helmet. Complete parts (a) and (b) below. Click the icon to view the tables. (a) Does the distribution of fatal injuries for riders not wearing a helmet follow the distribution for all riders? Use α = 0.05 level of significance. What are the null and alternative hypotheses? O A. Ho: The distribution of fatal injuries for riders not wearing a helmet follows the same distribution for all other riders. H₁: The distribution of fatal injuries for riders not wearing a helmet does not follow the same distribution for all other riders. B. Ho: The distribution of fatal injuries for riders not wearing a helmet does not follow the same distribution for all other riders. H₁: The…arrow_forwardThe average fruit fly will lay 377 eggs into rotting fruit. A biologist wants to see if the average will be greater for flies that have a certain gene modified. The data below shows the number of eggs that were laid into rotting fruit by several fruit flies that had this gene modified. Assume that the distribution of the population is normal. 367, 374, 364, 388, 407, 369, 375, 362, 403, 383, 381, 391, 371 What can be concluded at the the αα = 0.10 level of significance level of significance? The test statistic = (please show your answer to 3 decimal places.) The p-value = (Please show your answer to 4 decimal places.)arrow_forwardFor the residents in 2014, use R to calculate the interval with 99% certainty that the interval contains the actual population mean of the residents by census tracts. Type in the interval with keyboard. We also know that in each year, the number of residents by census tract in the State of Maryland follows a normal distribution, and the variance in the number of residents within the State of Maryland is the same for different years. POP2014: 3072, 1989, 3794, 2689, 3211, 3722, 4385, 4009, 7598, 3862, 3097, 2726, 4881, 4157, 2570, 2512, 2518, 4863, 4147, 7139, 6067, 6819, 3705, 3239, 3824, 4977, 2576, 2940, 9791, 5231, 5634, 5337, 4205, 3888, 5562, 3335, 3770, 1808, 2045, 1532, 5420, 4993, 6109, 4377, 5424, 4976, 4507, 3738, 2827, 3485, 1559, 5199, 4702, 3971, 3803, 3356, 4670, 3816, 5477, 4760, 3126, 3630, 3755, 3795, 2578, 3382, 4005, 2442, 6096, 3799, 3843, 3836, 6046, 6431, 3561, 3142, 4829, 5058, 2471, 6119, 3523, 3094, 3146, 3356, 2618, 2366, 4266, 4016, 6080, 1554, 6878, 3645,…arrow_forward
- Find the 5 number summary for the data shown 3 18 24 26 28 38 55 63 65 67 5 number summary: 3 65 64 64 X, 21 IQR:|| The 1.5 x IQR rule states that values between and are likely not outliers.arrow_forward3 partsarrow_forwardThe average fruit fly will lay 375 eggs into rotting fruit. A biologist wants to see if the average will be greater for flies that have a certain gene modified. The data below shows the number of eggs that were laid into rotting fruit by several fruit flies that had this gene modified. Assume that the distribution of the population is normal. 379, 406, 378, 394, 369, 369, 402, 383, 367, 357, 401, 407, 357, 394, 367 What can be concluded at the the a = 0.05 level of significance level of significance? a. For this study, we should use t-test for a population mean b. The null and alternative hypotheses would be: Ho: H1: C. The test statistic (please show your answer to 3 decimal places.) d. The p-value (Please show your answer %D to 4 decimal places.)arrow_forward
- 2.7 - a. Write a few short sentences that compare the center and the spread for each dot plot. b. Based on this sample, cereals from which manufacturer tend to have no variation in calories?arrow_forwardA physics professor wishes to compare quiz grades between her two classes. The quiz was worth 10 points. The dot plots show the grade distributions. 4 10 9. Class A 10 Class B Each dot represents a What was the lowest quiz grade in Class A? What was the highest quiz grade in Class 8?arrow_forwardb. Calculate the range. Range= c. Calculate the interquartile range, IQR. IQR= d. State whether the distribution is symmetric, skewed left, or skewed right. Symmetric Skewed left Skewed right e. Would you expect the mean to be greater than, equal, or less than the median? Equal Greater than Less thanarrow_forward
arrow_back_ios
arrow_forward_ios
Recommended textbooks for you
- MATLAB: An Introduction with ApplicationsStatisticsISBN:9781119256830Author:Amos GilatPublisher:John Wiley & Sons Inc
 Probability and Statistics for Engineering and th...StatisticsISBN:9781305251809Author:Jay L. DevorePublisher:Cengage Learning
 Statistics for The Behavioral Sciences (MindTap C...StatisticsISBN:9781305504912Author:Frederick J Gravetter, Larry B. WallnauPublisher:Cengage Learning
  Elementary Statistics: Picturing the World (7th E...StatisticsISBN:9780134683416Author:Ron Larson, Betsy FarberPublisher:PEARSON
 The Basic Practice of StatisticsStatisticsISBN:9781319042578Author:David S. Moore, William I. Notz, Michael A. FlignerPublisher:W. H. Freeman
 Introduction to the Practice of StatisticsStatisticsISBN:9781319013387Author:David S. Moore, George P. McCabe, Bruce A. CraigPublisher:W. H. Freeman
MATLAB: An Introduction with Applications
Statistics
ISBN:9781119256830
Author:Amos Gilat
Publisher:John Wiley & Sons Inc
Probability and Statistics for Engineering and th...
Statistics
ISBN:9781305251809
Author:Jay L. Devore
Publisher:Cengage Learning
Statistics for The Behavioral Sciences (MindTap C...
Statistics
ISBN:9781305504912
Author:Frederick J Gravetter, Larry B. Wallnau
Publisher:Cengage Learning
Elementary Statistics: Picturing the World (7th E...
Statistics
ISBN:9780134683416
Author:Ron Larson, Betsy Farber
Publisher:PEARSON
The Basic Practice of Statistics
Statistics
ISBN:9781319042578
Author:David S. Moore, William I. Notz, Michael A. Fligner
Publisher:W. H. Freeman
Introduction to the Practice of Statistics
Statistics
ISBN:9781319013387
Author:David S. Moore, George P. McCabe, Bruce A. Craig
Publisher:W. H. Freeman