
Essentials Of Investments
11th Edition
ISBN: 9781260013924
Author: Bodie, Zvi, Kane, Alex, MARCUS, Alan J.
Publisher: Mcgraw-hill Education,
expand_more
expand_more
format_list_bulleted
Related questions
Question
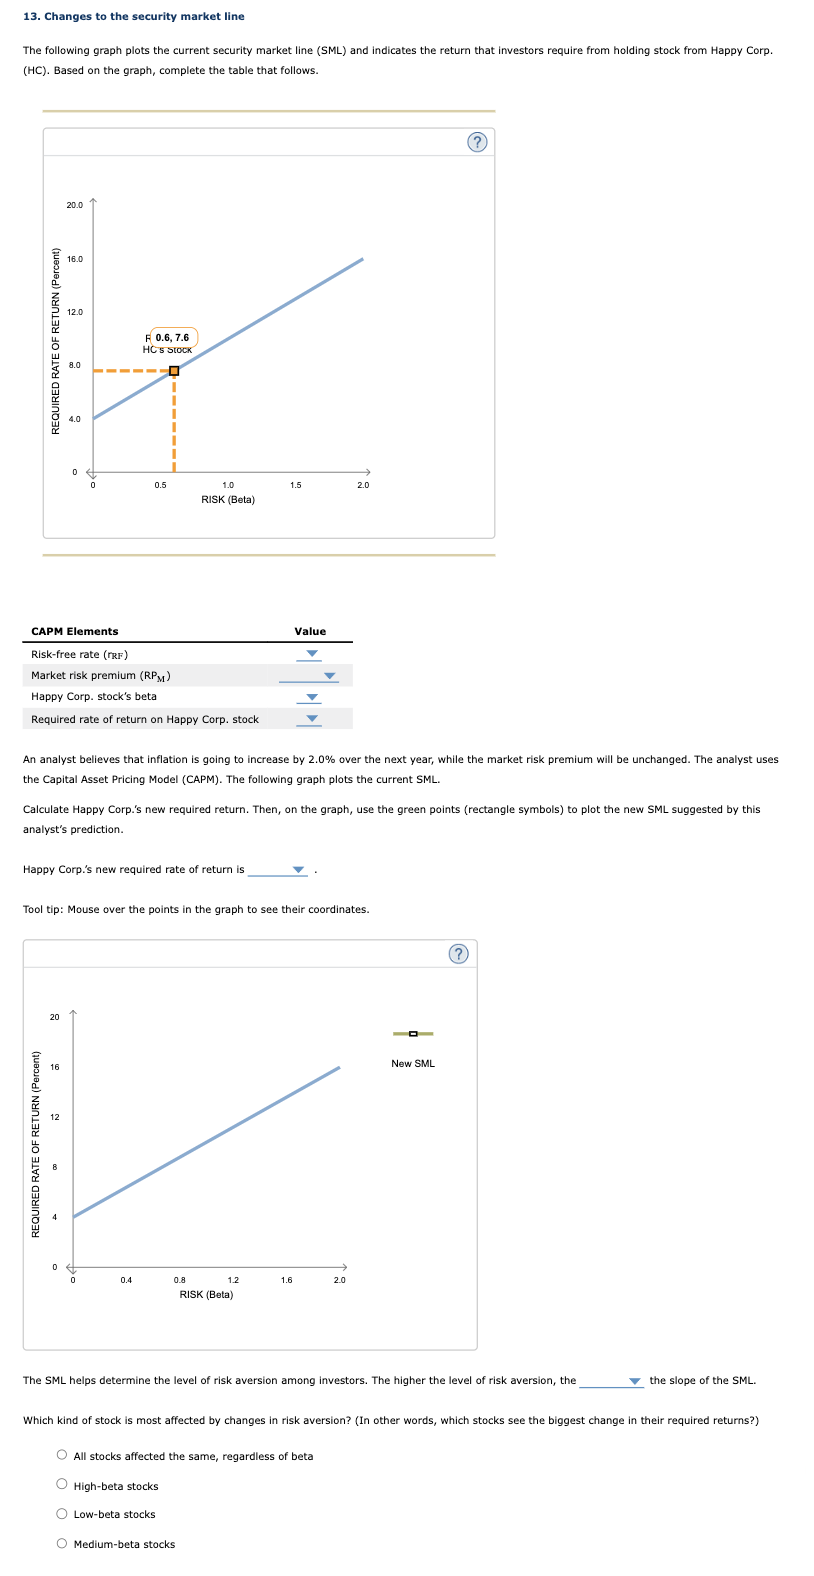

Transcribed Image Text:13. Changes to the security market line
The following graph plots the current security market line (SML) and indicates the return that investors require from holding stock from Happy Corp.
(HC). Based on the graph, complete the table that follows.
REQUIRED RATE OF RETURN (Percent)
REQUIRED RATE OF RETURN (Percent)
20.0
16.0
20
12.0
16
8.0
12
4.0
0
0
CAPM Elements
Risk-free rate (TRF)
Market risk premium (RPM)
Happy Corp. stock's betal
Required rate of return on Happy Corp. stock
0
Happy Corp.'s new required rate of return is
F 0.6, 7.6
HC's Stock
☐
0.5
An analyst believes that inflation is going to increase by 2.0% over the next year, while the market risk premium will be unchanged. The analyst uses
the Capital Asset Pricing Model (CAPM). The following graph plots the current SML.
Calculate Happy Corp.'s new required return. Then, on the graph, use the green points (rectangle symbols) to plot the new SML suggested by this
analyst's prediction.
0
1.0
RISK (Beta)
Tool tip: Mouse over the points in the graph to see their coordinates.
0.4
0.8
1.5
1.2
Value
RISK (Beta)
1.6
2.0
2.0
(?)
O All stocks affected the same, regardless of beta
O High-beta stocks
O Low-beta stocks
O Medium-beta stocks
New SML
(?)
The SML helps determine the level of risk aversion among investors. The higher the level of risk aversion, the
the slope of the SML.
Which kind of stock is most affected by changes in risk aversion? (In other words, which stocks see the biggest change in their required returns?)
SAVE
AI-Generated Solution
info
AI-generated content may present inaccurate or offensive content that does not represent bartleby’s views.
Unlock instant AI solutions
Tap the button
to generate a solution
to generate a solution
Click the button to generate
a solution
a solution
Knowledge Booster

Similar questions
- Market risk premiumarrow_forwardThe Capital Asset Pricing Model (CAPM) says that the risk premium on a stock is equal to its beta times the market risk premium. ..... True Falsearrow_forwardAssume that using the Security Market Line (SML) the required rate of return (RA) on stock A is foundto be half of the required return (RB) on stock B. The risk-free rate (Rf) is one-fourth of the requiredreturn on A. Return on market portfolio is denoted by RM. Find the ratio of beta of A (A) to beta of B(B). d) Assume that the short-term risk-free rate is 3%, the market index S&P500 is expected to payreturns of 15% with the standard deviation equal to 20%. Asset A pays on average 5%, has standarddeviation equal to 20% and is NOT correlated with the S&P500. Asset B pays on average 8%, also hasstandard deviation equal to 20% and has correlation of 0.5 with the S&P500. Determine whetherasset A and B are overvalued or undervalued, and explain why. (Hint: Beta of asset i (??) =???????, where ??,?? are standard deviations of asset i and marketportfolio, ??? is the correlation between asset i and the market portfolio)Question 2. Foreign exchange marketsStatoil, the national…arrow_forward
- (c)) Discuss the following graphic, which shows the relationship between expected return and portfolio weights. The portfolio is comprised of a debt security D and an equity security E. What would the portfolio strategy be when Wp = 2 and ba WE = -1? 38 (33) -0.5 Expected Return 13% 8% Debt Fund 0 (ebenso) esenicut adol leu@ ledol (loorba (ognerloxel) Ismet tametnl Equity Fund 1.0 0 OC) becida nieu to 2.0 w (stocks) AB -1.0 68 XO.YOUTS RO w (bonds)=1-w (stocks) 15 V10 anollesup Figure 7.3 Portfolio expected return as a function of investment proportions la 21101TOarrow_forwardSuppose securities A, B, and C have the following expected return and risk. Stock Expected return Risk A 8% 6% B 7% 9% C 13% 9% What is the coefficient of variation for stock A?arrow_forwardQUESTION Assume that the expected rates of return and the beta coefficients of the alternatives supplied by an independent analyst are as follows: Security Estimated rate of returns Beta Nescom 5% 1.5 Market 4 1 Pk_Steel 3.5 0.75 T_Bills 3 0 Nawab 1 -0.6 What is a beta coefficient, and how are betas used in risk analysis? Do the expected returns appear to be related to each alternative’s market risk? Is it possible to choose among the alternatives on the basis of the information developed thus far?arrow_forward
- Consider following information on a risky portfolio, risk-free asset and the market index. What is the Sharpe ratio of the market index? Risky portfolio Risk-free asset Market index Average return 8.2% 2% 6% Std. Dev. 26% 20% Residual std. dev. 10% Alpha 1.4% Beta 1.2arrow_forwardWhat is the beta of a portfolio comprised of the following securities? Stock Amount Invested Security Beta- 0.86 1.76 1.35 A B C $3600 $ 2800 $ 9000 Beta of portfolio to 2 decimal places is Numeric Responsearrow_forwardmc question attachedarrow_forward
- You have developed the following data to examine the impact of portfolio diversification. Which scenario seems to be out of place? # of stocks in the portfolio Diversifiable Risk Market Risk L. 2 stocks M. 20 stocks N. 30 stocks O. 60 stocks P. 100 stocks ΟΝ OL O M P 0.15 0.07 0.11 0.08 0.06 0.20 0.20 0.20 0.20 0.20arrow_forwardCurrent yield is used to determine Seleccione una: a. A portion of the yield on an investment b. The payout of a bond investment c. The amount of money a bond investor will earn d. The coupon rate of a bond investmentarrow_forwardAssume that you are given the following historical returns for the Market and Security J. Also assume that the expected risk-free rate for the coming year is 4.0 percent, while the expected market risk premium is 15.0 percent. Given this information, determine the required rate of return for Security J for the coming year, using CAPM. Year 1 2 O21.20% 3 4 5 6 O22.34% O 23.49% O24.63% O24.10% Market 10.00% 12.00% 16.00% 14.00% 12.00% 10.00% Security J 12.00% 14.00% 18.00% 22.00% 18.00% 14.00%arrow_forward
arrow_back_ios
SEE MORE QUESTIONS
arrow_forward_ios
Recommended textbooks for you
- Essentials Of InvestmentsFinanceISBN:9781260013924Author:Bodie, Zvi, Kane, Alex, MARCUS, Alan J.Publisher:Mcgraw-hill Education,


 Foundations Of FinanceFinanceISBN:9780134897264Author:KEOWN, Arthur J., Martin, John D., PETTY, J. WilliamPublisher:Pearson,
 Fundamentals of Financial Management (MindTap Cou...FinanceISBN:9781337395250Author:Eugene F. Brigham, Joel F. HoustonPublisher:Cengage Learning
 Corporate Finance (The Mcgraw-hill/Irwin Series i...FinanceISBN:9780077861759Author:Stephen A. Ross Franco Modigliani Professor of Financial Economics Professor, Randolph W Westerfield Robert R. Dockson Deans Chair in Bus. Admin., Jeffrey Jaffe, Bradford D Jordan ProfessorPublisher:McGraw-Hill Education
Essentials Of Investments
Finance
ISBN:9781260013924
Author:Bodie, Zvi, Kane, Alex, MARCUS, Alan J.
Publisher:Mcgraw-hill Education,
Foundations Of Finance
Finance
ISBN:9780134897264
Author:KEOWN, Arthur J., Martin, John D., PETTY, J. William
Publisher:Pearson,
Fundamentals of Financial Management (MindTap Cou...
Finance
ISBN:9781337395250
Author:Eugene F. Brigham, Joel F. Houston
Publisher:Cengage Learning
Corporate Finance (The Mcgraw-hill/Irwin Series i...
Finance
ISBN:9780077861759
Author:Stephen A. Ross Franco Modigliani Professor of Financial Economics Professor, Randolph W Westerfield Robert R. Dockson Deans Chair in Bus. Admin., Jeffrey Jaffe, Bradford D Jordan Professor
Publisher:McGraw-Hill Education