MATLAB: An Introduction with Applications
6th Edition
ISBN: 9781119256830
Author: Amos Gilat
Publisher: John Wiley & Sons Inc
expand_more
expand_more
format_list_bulleted
Concept explainers
Question
thumb_up100%
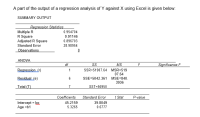
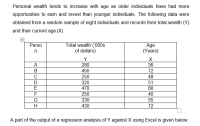
1. State the estimated regression line and interpret the slope.
2. What is the estimated total personal wealth when a person is 50 years old?
3. What is the value of the coefficient of determination? Interpret


Expert Solution
This question has been solved!
Explore an expertly crafted, step-by-step solution for a thorough understanding of key concepts.
This is a popular solution
Trending nowThis is a popular solution!
Step by stepSolved in 3 steps with 1 images

Knowledge Booster
Learn more about
Need a deep-dive on the concept behind this application? Look no further. Learn more about this topic, statistics and related others by exploring similar questions and additional content below.Similar questions
- please please help me and make answer clear!!! thanks so mucharrow_forward13. Find the regression equation, letting the diameter be the predictor (x) variable. Find the best predicted circumference of a marble with a diameter of 1.2 cm. How does the result compare to the actual circumference of 3.8 cm? Use a significance level of 0.05. Baseball Basketball Golf Soccer Tennis Ping-Pong Volleyball 20.7 7.5 24.4 4.2 22.3 7.1 4.0 Diameter Circumference 23.6 76.7 13.2 70.1 22.3 12.6 65.0 6. Click the icon to view the critical values of the Pearson correlation coefficient r. The regression equation is y = (Round to five decimal places as needed.) X. The best predicted circumference for a diameter of 1.2 cm is (Round to one decimal place as needed.) ст. How does the result compare to the actual circumference of 3.8 cm? O A. Even though 1.2 cm is beyond the scope of the sample diameters, the predicted value yields the actual circumference. O B. Since 1.2 cm is within the scope of the sample diameters, the predicted value yields the actual circumference. O C. Since…arrow_forwardBased on the analyst's data and regression line, complete the following. For these data, values for earnings per share that are greater than the mean of the values for earnings per share tend to be paired with current stock prices that are (greater than, lesser than) the mean of the current stock prices. According to the regression equation, for an increase of one dollar in earnings per share, there is a corresponding increase of how many dollars in current stock price?arrow_forward
- Using the regression formula with a slope = 5000 and intercept = 10,000, what would the predicted income be for someone who has 15 years of education? A. 60,000 B. 150,000 C. 85,000 D. 75,000arrow_forwardYou do a survey where you ask people both their age and their income. You want to see if there is a relationship between these two variables, and you want to create an equation you can use to predict someone’s age from his/her income. What kind of hypothesis test or analysis should you do?a. One-Factor, Independent-Measures ANOVAb. Two-Factor ANOVAc. Correlation/Regressiond. Chi-Square Goodness of Fitarrow_forwardplease answer in text form and in proper format answer with must explanation , calculation for each part and steps clearlyarrow_forward
- The amount of time adults spend watching television is closely monitored by firms because this helps to determine advertising pricing for commercials. Complete parts (a) through (d). C (a) Do you think the variable "weekly time spent watching television" would be normally distributed? If not, what shape would you expect the variable to have? A. The variable "weekly time spent watching television" is likely skewed right, not normally distributed. OB. The variable "weekly time spent watching television" is likely symmetric, but not normally distributed. O C. The variable "weekly time spent watching television" is likely skewed left, not normally distributed. O D. The variable "weekly time spent watching television" is likely normally distributed. O E. The variable "weekly time spent watching television" likely uniform, not normally distributed. (b) According to a certain survey, adults spend 2.45 hours per day watching television on a weekday. Assume that the standard deviation for "time…arrow_forwardd. Using the regression results reported above, please calculate and interpret the separate effects of being an athlete on college GPA for men and women.arrow_forwardThe mall has a set of data with employee age (X) and the corresponding number of annual on-the-job-accidents(Y). Analysis on the set finds that the regression equation is Y=100-3X. What is the likely number of accidents for someone aged 30? 97 100 10 none of the abovearrow_forward
- What is the dollar amount of change in sales for each new year according to the regression (slope) model? Do not use commas or $ in your answer.arrow_forwardAn experiment is run. The mass of an object is recorded over time. Time (min) Mass (g) 32 40 36 32 37 32 39 30 50 27 Using your calculator, run a linear regression to determine the equation of the line of best fit. Round to two decimal places, use x for the variable.y=Using your equation, estimate the mass of the object at 41 minutes.grams=arrow_forward2. A professor wants to see how much students learn over the course of a semester. A pre test is given before the class begins to see what students know ahead of time, and the same test is given at the end of the semester to see what students know at the end. The data are below. Test for an improvement at the a = 0.05 level. Did scores increase? How much did scores increase? Pretest 90 Posttest Xp 89 60 66 95 99 93 91 95 100 64 67 89 91 90 95 95 94 83 89 75 82 87 92 82 83 85 82 88 93 66 90 69 90 93 100 86 95 91 96arrow_forward
arrow_back_ios
SEE MORE QUESTIONS
arrow_forward_ios
Recommended textbooks for you
 MATLAB: An Introduction with ApplicationsStatisticsISBN:9781119256830Author:Amos GilatPublisher:John Wiley & Sons Inc
 Probability and Statistics for Engineering and th...StatisticsISBN:9781305251809Author:Jay L. DevorePublisher:Cengage Learning
 Statistics for The Behavioral Sciences (MindTap C...StatisticsISBN:9781305504912Author:Frederick J Gravetter, Larry B. WallnauPublisher:Cengage Learning
 Elementary Statistics: Picturing the World (7th E...StatisticsISBN:9780134683416Author:Ron Larson, Betsy FarberPublisher:PEARSON
 The Basic Practice of StatisticsStatisticsISBN:9781319042578Author:David S. Moore, William I. Notz, Michael A. FlignerPublisher:W. H. Freeman
 Introduction to the Practice of StatisticsStatisticsISBN:9781319013387Author:David S. Moore, George P. McCabe, Bruce A. CraigPublisher:W. H. Freeman

MATLAB: An Introduction with Applications
Statistics
ISBN:9781119256830
Author:Amos Gilat
Publisher:John Wiley & Sons Inc

Probability and Statistics for Engineering and th...
Statistics
ISBN:9781305251809
Author:Jay L. Devore
Publisher:Cengage Learning

Statistics for The Behavioral Sciences (MindTap C...
Statistics
ISBN:9781305504912
Author:Frederick J Gravetter, Larry B. Wallnau
Publisher:Cengage Learning

Elementary Statistics: Picturing the World (7th E...
Statistics
ISBN:9780134683416
Author:Ron Larson, Betsy Farber
Publisher:PEARSON

The Basic Practice of Statistics
Statistics
ISBN:9781319042578
Author:David S. Moore, William I. Notz, Michael A. Fligner
Publisher:W. H. Freeman

Introduction to the Practice of Statistics
Statistics
ISBN:9781319013387
Author:David S. Moore, George P. McCabe, Bruce A. Craig
Publisher:W. H. Freeman