
MATLAB: An Introduction with Applications
6th Edition
ISBN: 9781119256830
Author: Amos Gilat
Publisher: John Wiley & Sons Inc
expand_more
expand_more
format_list_bulleted
Related questions
Question
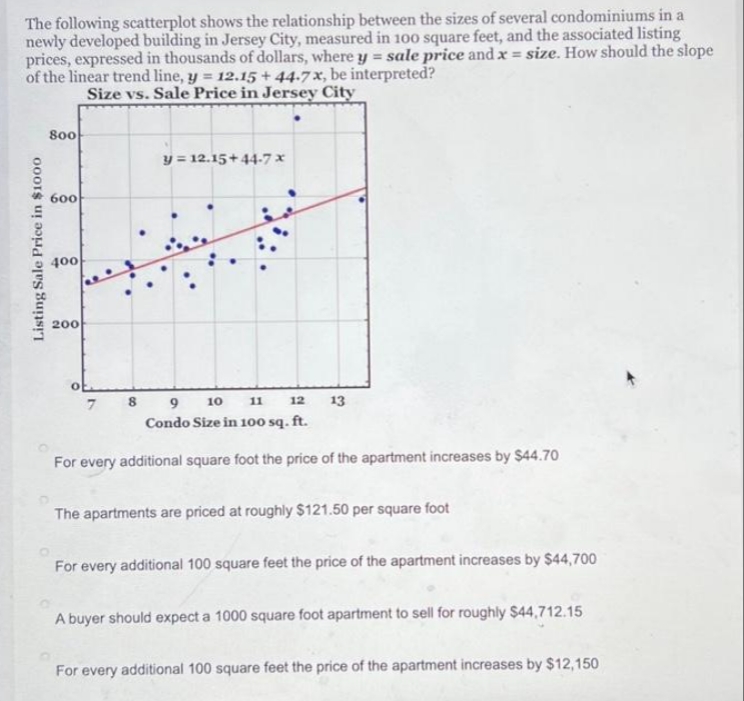

Transcribed Image Text:The following scatterplot shows the relationship between the sizes of several condominiums in a
newly developed building in Jersey City, measured in 100 square feet, and the associated listing
prices, expressed in thousands of dollars, where y = sale price and x = size. How should the slope
of the linear trend line, y = 12.15 + 44.7 x, be interpreted?
Size vs. Sale Price in Jersey City
Listing Sale Price in $1000
800
600
400
200
y = 12.15+44-7x
7
8 9
10
11
12
Condo Size in 100 sq. ft.
For every additional square foot the price of the apartment increases by $44.70
13
The apartments are priced at roughly $121.50 per square foot
For every additional 100 square feet the price of the apartment increases by $44,700
A buyer should expect a 1000 square foot apartment to sell for roughly $44,712.15
For every additional 100 square feet the price of the apartment increases by $12,150
Expert Solution
This question has been solved!
Explore an expertly crafted, step-by-step solution for a thorough understanding of key concepts.

This is a popular solution

Trending nowThis is a popular solution!

Step by stepSolved in 3 steps with 2 images

Knowledge Booster

Similar questions
- A university would like to examine the linear relationship between a faculty member's performance rating (measured on a scale of 1-20) and his or her annual salary increase. The table to the right shows these data for eight randomly selected faculty members. Complete parts a and b.arrow_forwardIn the following scatterplots, find an equation of the trend line pictured. а. 3- a. Choose an equation below. 2- 1 A. y= - 7x* 10 - EX +E -3 1 В. у3 —х- 10 3 1 -2- O C. y= -x+ 10 -3- 4 O D. y= 7x- 10arrow_forwardThe following data represents the prices of gasoline in the United States from 2004 to 2010. YEAR GAS PRICE 2004 $1.88 2005 $2.30 2006 $2.59 2007 $2.80 2008 $3.27 2009 $2.35 2010 $2.79 Construct a line graph as if you were a representative of the oil company. EXPLAIN THE REASONING for your construction. Construct a line graph as if you were representing a consumer advocacy group.…arrow_forward
arrow_back_ios
arrow_forward_ios
Recommended textbooks for you
- MATLAB: An Introduction with ApplicationsStatisticsISBN:9781119256830Author:Amos GilatPublisher:John Wiley & Sons Inc
 Probability and Statistics for Engineering and th...StatisticsISBN:9781305251809Author:Jay L. DevorePublisher:Cengage Learning
 Statistics for The Behavioral Sciences (MindTap C...StatisticsISBN:9781305504912Author:Frederick J Gravetter, Larry B. WallnauPublisher:Cengage Learning
  Elementary Statistics: Picturing the World (7th E...StatisticsISBN:9780134683416Author:Ron Larson, Betsy FarberPublisher:PEARSON
 The Basic Practice of StatisticsStatisticsISBN:9781319042578Author:David S. Moore, William I. Notz, Michael A. FlignerPublisher:W. H. Freeman
 Introduction to the Practice of StatisticsStatisticsISBN:9781319013387Author:David S. Moore, George P. McCabe, Bruce A. CraigPublisher:W. H. Freeman
MATLAB: An Introduction with Applications
Statistics
ISBN:9781119256830
Author:Amos Gilat
Publisher:John Wiley & Sons Inc
Probability and Statistics for Engineering and th...
Statistics
ISBN:9781305251809
Author:Jay L. Devore
Publisher:Cengage Learning
Statistics for The Behavioral Sciences (MindTap C...
Statistics
ISBN:9781305504912
Author:Frederick J Gravetter, Larry B. Wallnau
Publisher:Cengage Learning
Elementary Statistics: Picturing the World (7th E...
Statistics
ISBN:9780134683416
Author:Ron Larson, Betsy Farber
Publisher:PEARSON
The Basic Practice of Statistics
Statistics
ISBN:9781319042578
Author:David S. Moore, William I. Notz, Michael A. Fligner
Publisher:W. H. Freeman
Introduction to the Practice of Statistics
Statistics
ISBN:9781319013387
Author:David S. Moore, George P. McCabe, Bruce A. Craig
Publisher:W. H. Freeman