
EBK JAVA PROGRAMMING
9th Edition
ISBN: 9781337671385
Author: FARRELL
Publisher: CENGAGE LEARNING - CONSIGNMENT
expand_more
expand_more
format_list_bulleted
Related questions
Question
thumb_up100%
Please show the code for each part of this assignment using python in a jupyter notebook. The data file previoulsy used that is referenced in the first part is included
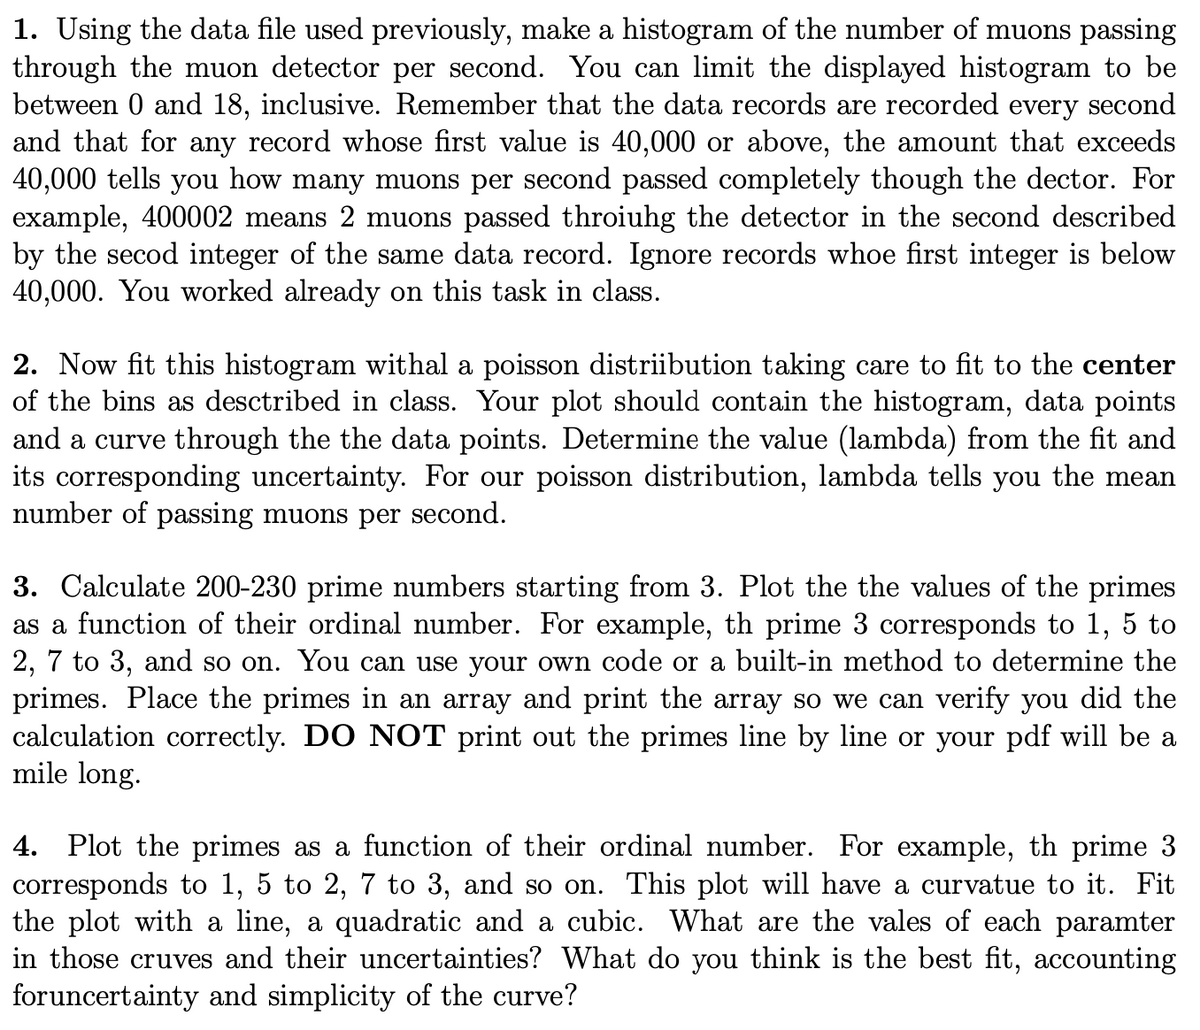

Transcribed Image Text:1. Using the data file used previously, make a histogram of the number of muons passing
through the muon detector per second. You can limit the displayed histogram to be
between 0 and 18, inclusive. Remember that the data records are recorded every second
and that for any record whose first value is 40,000 or above, the amount that exceeds
40,000 tells you how many muons per second passed completely though the dector. For
example, 400002 means 2 muons passed throiuhg the detector in the second described
by the secod integer of the same data record. Ignore records whoe first integer is below
40,000. You worked already on this task in class.
2. Now fit this histogram withal a poisson distriibution taking care to fit to the center
of the bins as described in class. Your plot should contain the histogram, data points
and a curve through the the data points. Determine the value (lambda) from the fit and
its corresponding uncertainty. For our poisson distribution, lambda tells you the mean
number of passing muons per second.
3. Calculate 200-230 prime numbers starting from 3. Plot the the values of the primes
as a function of their ordinal number. For example, th prime 3 corresponds to 1, 5 to
2, 7 to 3, and so on. You can use your own code or a built-in method to determine the
primes. Place the primes in an array and print the array so we can verify you did the
calculation correctly. DO NOT print out the primes line by line or your pdf will be a
mile long.
4. Plot the primes as a function of their ordinal number. For example, th prime 3
corresponds to 1, 5 to 2, 7 to 3, and so on. This plot will have a curvatue to it. Fit
the plot with a line, a quadratic and a cubic. What are the vales of each paramter
in those cruves and their uncertainties? What do you think is the best fit, accounting
foruncertainty and simplicity of the curve?
![In [12]: #Problem 3
from numpy.random import random
tnp. linspace (-1, 1, 201)
plt.subplot(2, 2, 1); plt.hist (random(500) 21, t)
plt.subplot(2, 2, 2); plt.plot(t, t**2, t, t**3 - t)
plt.subplot(2, 2, 3); plt.scatter ((random (100)
plt.subplot(2, 2, 4); plt.plot(t
plt.suptitle('Data Visualization')
2) -1, (random(100) * 2)
np.cos (10 *t), tnp.sin(10 * t))
Out [12]: Text (0.5, 0.98, 'Data Visualization')
ttps://hpc.m3.smu.edu/node/c002/8909/lab/tree/saltzman_hw2.ipynb
0/3/24, 4:35 PM
In []:
8
6
4
saltzman_hw2
Data Visualization
1.0
0.5
0.0
2
0
-1.0 -0.5
0.0
0.5
1.0
-1.0 -0.5 0.0
0.5
1.0
1.0
0.75
0.50
0.5
0.25
0.0
0.00
-0.5
+0.25
0.50
-1.0
-1.0
-0.5
0.0
0.5
1.0
-1.0
-0.5
0.0
0.5
1.0](https://content.bartleby.com/qna-images/question/62a79166-ba2c-43d7-9fa1-94c5c5be2063/b1bfa1d1-ba3f-4c42-98b5-900790d18530/navrbbp_processed.png)
Transcribed Image Text:In [12]: #Problem 3
from numpy.random import random
tnp. linspace (-1, 1, 201)
plt.subplot(2, 2, 1); plt.hist (random(500) 21, t)
plt.subplot(2, 2, 2); plt.plot(t, t**2, t, t**3 - t)
plt.subplot(2, 2, 3); plt.scatter ((random (100)
plt.subplot(2, 2, 4); plt.plot(t
plt.suptitle('Data Visualization')
2) -1, (random(100) * 2)
np.cos (10 *t), tnp.sin(10 * t))
Out [12]: Text (0.5, 0.98, 'Data Visualization')
ttps://hpc.m3.smu.edu/node/c002/8909/lab/tree/saltzman_hw2.ipynb
0/3/24, 4:35 PM
In []:
8
6
4
saltzman_hw2
Data Visualization
1.0
0.5
0.0
2
0
-1.0 -0.5
0.0
0.5
1.0
-1.0 -0.5 0.0
0.5
1.0
1.0
0.75
0.50
0.5
0.25
0.0
0.00
-0.5
+0.25
0.50
-1.0
-1.0
-0.5
0.0
0.5
1.0
-1.0
-0.5
0.0
0.5
1.0
Expert Solution
This question has been solved!
Explore an expertly crafted, step-by-step solution for a thorough understanding of key concepts.

Step by stepSolved in 2 steps

Knowledge Booster

Similar questions
- (Program) Write a program that tests the effectiveness of the rand() library function. Start by initializing 10 counters, such as zerocount, onecount, twocount, and so forth, to 0. Then generate a large number of pseudorandom integers between 0 and 9. Each time 0 occurs, increment zerocount; when 1 occurs, increment onecount; and so on. Finally, display the number of 0s, 1s, 2s, and so on that occurred and the percentage of time they occurred.arrow_forward(Numerical) Using the srand() and rand() C++ library functions, fill an array of 1000 floating-point numbers with random numbers that have been scaled to the range 1 to 100. Then determine and display the number of random numbers having values between 1 and 50 and the number having values greater than 50. What do you expect the output counts to be?arrow_forward(Numerical) Write a program that tests the effectiveness of the rand() library function. Start by initializing 10 counters to 0, and then generate a large number of pseudorandom integers between 0 and 9. Each time a 0 occurs, increment the variable you have designated as the zero counter; when a 1 occurs, increment the counter variable that’s keeping count of the 1s that occur; and so on. Finally, display the number of 0s, 1s, 2s, and so on that occurred and the percentage of the time they occurred.arrow_forward
- (Mechanics) The deflection at any point along the centerline of a cantilevered beam, such as the one used for a balcony (see Figure 5.15), when a load is distributed evenly along the beam is given by this formula: d=wx224EI(x2+6l24lx) d is the deflection at location x (ft). xisthedistancefromthesecuredend( ft).wistheweightplacedattheendofthebeam( lbs/ft).listhebeamlength( ft). Eisthemodulesofelasticity( lbs/f t 2 ).Iisthesecondmomentofinertia( f t 4 ). For the beam shown in Figure 5.15, the second moment of inertia is determined as follows: l=bh312 b is the beam’s base. h is the beam’s height. Using these formulas, write, compile, and run a C++ program that determines and displays a table of the deflection for a cantilevered pine beam at half-foot increments along its length, using the following data: w=200lbs/ftl=3ftE=187.2106lb/ft2b=.2fth=.3ftarrow_forward(Practice) Write a program to input eight integer numbers in an array named temp. As each number is input, add the numbers to a total. After all numbers are input, display the numbers and their average.arrow_forward
arrow_back_ios
arrow_forward_ios
Recommended textbooks for you
- EBK JAVA PROGRAMMINGComputer ScienceISBN:9781337671385Author:FARRELLPublisher:CENGAGE LEARNING - CONSIGNMENT
 Np Ms Office 365/Excel 2016 I NtermedComputer ScienceISBN:9781337508841Author:CareyPublisher:Cengage
 C++ for Engineers and ScientistsComputer ScienceISBN:9781133187844Author:Bronson, Gary J.Publisher:Course Technology Ptr
  C++ Programming: From Problem Analysis to Program...Computer ScienceISBN:9781337102087Author:D. S. MalikPublisher:Cengage LearningCOMPREHENSIVE MICROSOFT OFFICE 365 EXCEComputer ScienceISBN:9780357392676Author:FREUND, StevenPublisher:CENGAGE LProgramming Logic & Design ComprehensiveComputer ScienceISBN:9781337669405Author:FARRELLPublisher:Cengage
EBK JAVA PROGRAMMING
Computer Science
ISBN:9781337671385
Author:FARRELL
Publisher:CENGAGE LEARNING - CONSIGNMENT
Np Ms Office 365/Excel 2016 I Ntermed
Computer Science
ISBN:9781337508841
Author:Carey
Publisher:Cengage
C++ for Engineers and Scientists
Computer Science
ISBN:9781133187844
Author:Bronson, Gary J.
Publisher:Course Technology Ptr
C++ Programming: From Problem Analysis to Program...
Computer Science
ISBN:9781337102087
Author:D. S. Malik
Publisher:Cengage Learning
COMPREHENSIVE MICROSOFT OFFICE 365 EXCE
Computer Science
ISBN:9780357392676
Author:FREUND, Steven
Publisher:CENGAGE L
Programming Logic & Design Comprehensive
Computer Science
ISBN:9781337669405
Author:FARRELL
Publisher:Cengage