Related questions
Question

Transcribed Image Text:Position, Velocity, and Acceleration
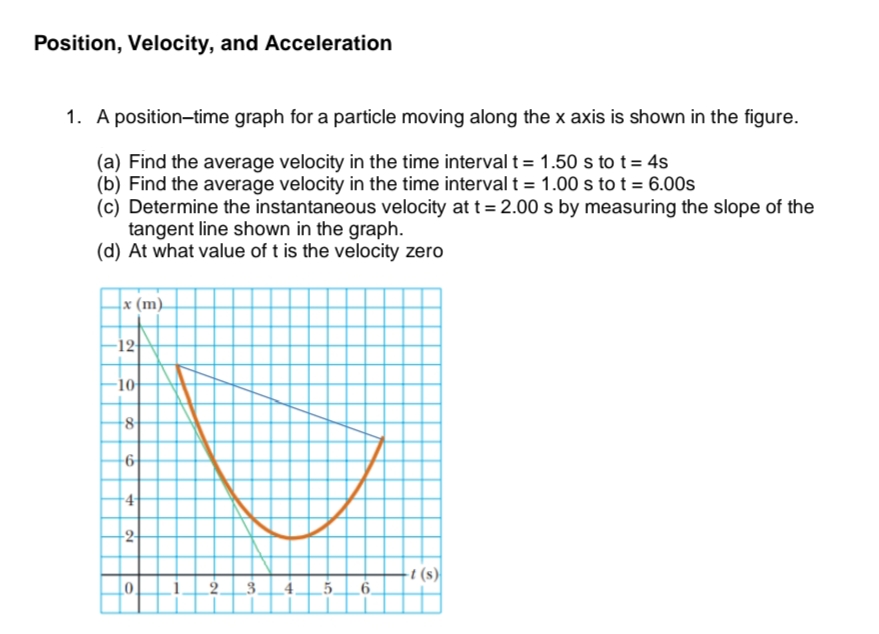
1. A position-time graph for a particle moving along the x axis is shown in the figure.
(a) Find the average velocity in the time interval t= 1.50 s to t= 4s
(b) Find the average velocity in the time interval t = 1.00 s to t = 6.00s
(c) Determine the instantaneous velocity at t=2.00 s by measuring the slope of the
tangent line shown in the graph.
(d) At what value of t is the velocity zero
x (m).
-12
-1아
-2
2.
_3__4_5_6.
4.
Expert Solution
This question has been solved!
Explore an expertly crafted, step-by-step solution for a thorough understanding of key concepts.

Step by stepSolved in 3 steps with 2 images

Knowledge Booster

Similar questions
- 5. A cyclist rides 8.0 km east for 20 minutes, then he turns and heads west for 8 minutes and 3.2 km. Finally, he rides east for 16 km, which takes 40 minutes. (a) What is the final displacement of the cyclist? (b) What is his average velocity?arrow_forwardOn a plot of position x versus time t for an object's motion, what corresponds to the object's average velocity between instant ti and instant t2? A) intercept of the plot on the vertical axis (B) slope of a line connecting the corresponding points on the plot (c) inverse of the slope of a line connecting the corresponding points on the plot D) intercept of the plot on the horizontal axisarrow_forwardThe position of an object as a function of time is given as x = At3 + Bt2 + Ct + D . The constants are A = 2.41 m/s3 B = 1.37 m/s2 ' , C = -4.61 m/s, and D = 3.35 m. What is the velocity of the object at t = 19.10 s? m/sarrow_forward
- Position, Velocity, and Acceleration 1. A position-time graph for a particle moving along the x axis is shown in the figure. (a) Find the average velocity in the time interval t = 1.50 s to t = 4s (b) Find the average velocity in the time interval t = 1.00 s to t = 6.00s (c) Determine the instantaneous velocity at t = 2.00 s by measuring the slope of the tangent line shown in the graph. (d) At what value of t is the velocity zero x (m) -t (s) 5 -12 -10 -8 -6 4 2- 0. 9 3 6arrow_forwardProblem 2: Kinematics and vectors. An object is moving on the xy plane with velocities given by: V₂ x = (10.0-0.500t)1 and v = (-5.00t+0.025²) j Determine the following quantities: a. The displacement of the object as a function of time. b. The average velocity of the object from for the time interval from 0 to 10 s.arrow_forwardA particle moves in one dimension, and its position as a function of time is given by x (2.0 m/s)t + (-3.6 m/s²)e². (a) What is the particle's average velocity from t 0.45 s to t = 0.55 s? (Indicate the direction with the sign of your answer.) m/s (b) What is the particle's average velocity from t = 0.49 s to t = 0.51 s? (Indicate the direction with the sign of your answer.) m/s MacBook Air 888 F1 F2 F3 F4 F5 F6 @ #3 $4 3 4 Q W E R T Garrow_forward
- This is the vx-tgraph for an object moving along the x-axis. Which of the following descriptions of the motion is most accurate? Vx The object is speeding up at an increasing rate. The object's speed is changing at a steady rate. O The object is slowing down at an increasing rate. The object is slowing down at a decreasing rate. The object is speeding up at a decreasing rate.arrow_forwardA particle moves along the x axis. It is initially at the position 0.250 m, moving with velocity 0.090 m/s and acceleration -0.430 m/s2. Suppose it moves with constant acceleration for 5.80 s. (a) Find the position of the particle after this time. (b) Find its velocity at the end of this time interval. m/s We take the same particle and give it the same initial conditions as before. Instead of having a constant acceleration, it oscillates in simple harmonic motion for 5.80 s around the equilibrium position x = 0. Hint: the following problems are very sensitive to rounding, and you should keep all digits in your calculator. (c) Find the angular frequency of the oscillation. Hint: in SHM, a is proportional to x. /s (d) Find the amplitude of the oscillation. Hint: use conservation of energy. (e) Find its phase constant e, if cosine is used for the equation of motion. Hint: when taking the inverse of a trig function, there are always two angles but your calculator will tell you only one and…arrow_forwardVelocity Problem 1. The position of an object is given as a function of time as x(t) = (3.0 m/s)t + (2.0 m/s2)t2. What is the average velocity of the object between t-0.0s and t = 2.0 SParrow_forward
- 2a. A worker on a rooftop is startled by a snake, scoops it with a shovel and throws it down the building at 16 m/s. What maximum height does the snake attain? Answer: 13.06m Need Help With B &C Plz. b. How much time does the snake take to reach maximum height if initial velocity is 16m/s? c. From the fall of the snake, calculate the height of the building, if the velocity of the snake is 40m/sarrow_forwardan object has a velocity of (5.4 m/s)i - (5.8 m/s)j. over a period of 1.3 s, its velocity changes to (1.7 m/s)i + (5.9 m/s)j. What is the displacementarrow_forwardThe velocity of a particle moving along the x-axis varies in time according to the expression v(t) = α - βt2 where α = 52.9m/s , β = 3.72m/s3, and t is in seconds. a) Find the acceleration in the time interval from t = 0 to 2.97s in units of m/s2 b) Determine the acceleration of the particle tf = 2.97s in m/s2arrow_forward
arrow_back_ios
SEE MORE QUESTIONS
arrow_forward_ios