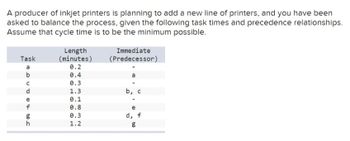
(1) Enter the number of the following tasks for each of the tasks shown in the table below.
| Task | Number of Following Task |
| a | |
| b | |
| c | |
| d | |
| e | |
| f | |
| g | |
| h |
| Work Station | Task Assigned |
| I | |
| II | |
| III | |
| IV |
| Percentage of idle time | ________ % |
(4) Determine the output rate that would be associated with using the maximum cycle time. (Round your answer to 2 decimal places.)
| Rate of output | ______________ units per day |
b.
(1) What is the shortest cycle time that will permit use of only two workstations? (Round your answer to 1 decimal place.)
| Shortest cycle time | ___________ minutes |
(2) Determine the percentage of idle time that would result if two stations were used and each station was loaded with the worktime shown in Part b(1). (Leave no cells blank - be certain to enter "0" wherever required.)
| Percentage of idle time | ____________% |
(3) What is the daily output under this arrangement a using the cycle time from Part b(1)? (Round your answer to 2 decimal places.)
| Daily output | ______________unit per day |
(4) Determine the output rate that would be associated with using the maximum cycle time. (Round your answer to 2 decimal places.)
| Rate of output | __________uniits per day |

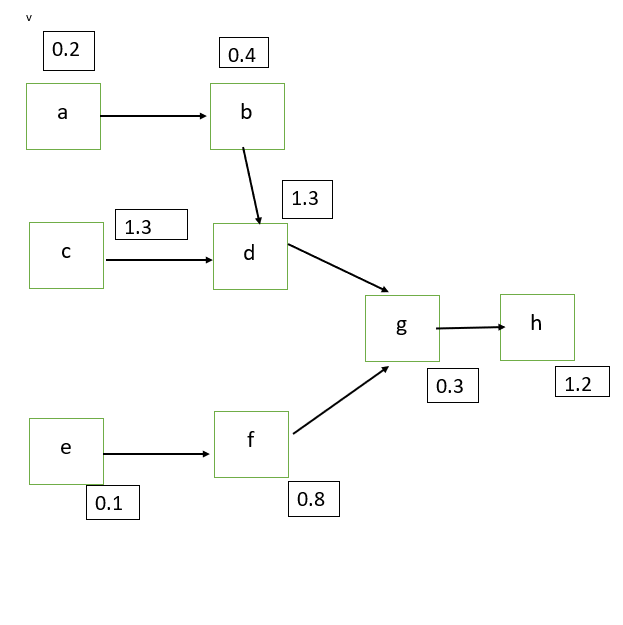
The Precedence diagram will be :

Maximum cycle time= Sum of tasks time = 0.2+0.4+0.3+1.3+0.1+0.8+0.3+1.2=4.6 minutes
Minimum cycle time= length of longest task=1.3 minutes
A number of work stations required=(sum of total task times) /(cycle time)
= 4.6/1.3
= 3.53 rounded off to 4
Therefore four workstations are required.
Trending nowThis is a popular solution!
Step by stepSolved in 3 steps with 1 images

- Please do fast ASAP fastarrow_forwardGiven the following information, assign tasks to work stations using the most followers rule. Assume the cycle time is 60 seconds. Submit for each workstation (1,2,3 etc.), the tasks assigned in order of assignment, the idle time for each work station and the total idle time. (It will help for you to make the diagram but you are not required to submit the diagram) Immediate Task Task Time (seconds) Predecessor 35 50 A. 20 10 25 F\ C.E 40 Edit Format Table Paragraph V BIUA 12pt v Immediate Predecessor Task Time (seconds) Taskarrow_forward1. Draw network diagram neatly using this chart provided: Activity Predecessor Normal time Normal cost Crash time Crash cost Max Crash Time Slope A 5 $200 4 $350 B A 8 $220 8 $220 C B 6 $250 4 $650 D A 9 $500 5 $600 E A,C 10 $150 9 $500 F E 10 $500 9 $650 G D,F 8 $400 6 $900arrow_forward
- Job times which includes processing and set up times are shown below: Job Job Time (bs) Due Date (bs) 15 24 20 8 6 A > B C D 12 6 14 3 7 B Using FCFS, determine the average flowtimearrow_forwarded from online tutor od 1. Use the assignment method to determine the best way to assign workers to jobs, given the following cost information. Compute the total cost for your assignment plan. JOB A B C 5 8 6 2 Worker 6 9 7 3 5 S 4 PROB 1 Tarrow_forwardPvnarrow_forward
 Practical Management ScienceOperations ManagementISBN:9781337406659Author:WINSTON, Wayne L.Publisher:Cengage,
 Operations ManagementOperations ManagementISBN:9781259667473Author:William J StevensonPublisher:McGraw-Hill Education
 Operations and Supply Chain Management (Mcgraw-hi...Operations ManagementISBN:9781259666100Author:F. Robert Jacobs, Richard B ChasePublisher:McGraw-Hill Education
 Purchasing and Supply Chain ManagementOperations ManagementISBN:9781285869681Author:Robert M. Monczka, Robert B. Handfield, Larry C. Giunipero, James L. PattersonPublisher:Cengage Learning
 Production and Operations Analysis, Seventh Editi...Operations ManagementISBN:9781478623069Author:Steven Nahmias, Tava Lennon OlsenPublisher:Waveland Press, Inc.


