1 3. 4 6. y 703 3295 8279 14390 25470 37673 Use linear regression to find the equation for the linear function that best fits this data. Round to two decimal places.


Q: Problem 1: The following data was taken from experiment. The data can be modeled by the following…
A: given,
Q: 2. The production and corresponding costing of a product in a factory is given below: Production…
A:
Q: The regression equation of two variables are 5y = 9x - 22 and 20x = 9y + 350 Find the means of x and…
A: 5y=9x-22∴5y-9x=-22and…
Q: The table below shows the quarterly sales of television set (in thousands) in an electrical…
A: Seasonal variation will be variation in a period series inside one year that is rehashed pretty much…
Q: A pharmacist has been monitoring sales of a certain over-the-counter pain reliever. Daily sales…
A: a) linear trend equation is to be suggested for this because, for sales of products, the linear…
Q: Develop a forecast for the fourth quarter using a three-quarter, weighted moving average. Weight the…
A: In the given data, actual sales are presented over the past 21 months, There are four quarters in…
Q: The following data relate the sales figures of the bar in Mark Kaltenbach's small bed-and-breakfast…
A: Linear Regression Assume X = Guests Y = Bar sales X Y XY X2 16 340…
Q: Consider the following time series data. Use trial and error to find a value of the exponential…
A: Exponential smoothing is the method for smoothing the data of the time series by using the function…
Q: Grant Healthcare produces latex gloves for hospitals. Grant is forecasting costs for future…
A: The possible independent variables for analysis of financial data are:
Q: What is the adjusted R-squared for your model
A: Number of independent variable (k) = 3Sample size (n) = 120R-squared (R2) = 0.68
Q: The manager wants to forecast the month 6's sales using the following historical data: Months Month…
A: Forecasting is the process of estimating the future demand using the previous years information and…
Q: An organization uses a business intelligence system to predict products that tend to be purchased…
A: RFM (Recency,Frequency,Monetary) Analysis is the method which uses the Quantitative data of the…
Q: 1. Solve manually. a. Income at the law firm Smith and Wesson for the period February to July was as…
A: Regression is a statistical technique used in finance, investing, and other fields to identify the…
Q: Rhonda Clark, a Slippery Rock, Pennsylvania, realestate developer, has devised a regression model to…
A: a) y = 13473 +37.65(1860) =$83502
Q: Curry Rubber manufactures rubber bands for retail companies. The accounting manager has performed a…
A: The R-squared value of .6 tells you that changes in the independent variable do not predict changes…
Q: Consider the following quarterly demand level for electricity (in 1000 megawatts) in Mankweng from…
A: Since you have submitted the multiple subparts, as per guidelines we have answered the first three…
Q: Suppose a social psychologist sets out to see whether having children is related to relationship…
A: The point biserial correlation coefficient (rpb) is the correlation coefficient used when one…
Q: f you can can you show me in Excel? That is my question for 25 students Below you are given the…
A: Given information, Student Score 1 52 2 99 3 83 4 82 5 84 6 23 7 25 8 76 9 90…
Q: Below you are given a partial computer output from a multiple regression analysis based on a sample…
A: Please find the attached answer in step 2
Q: The table below shows the violent crime rate in Canada between 1977 and 2004. a. Enter this data…
A: Quadratic regression equation is of form ax2+bx+c where a should not be equal to zero.
Q: Regression Analysis Data mining, or the use of large amounts of consumer data to predict…
A: 1. Data mining is the of analyzing data and useful information is finalized. Such information can be…
Q: iptive data analytic model? How are the two related or how are they different? Give example of each.
A: productivity analysis and prescriptive data analytic model
Q: (d) Fit a multiple linear regression model with an interaction term to these data. (e) Estimate o…
A: given,
Q: Consider the following ARMAX model: Y: = Bx; + P1Yt-1 + P2Yt-2 + & a. What is the effect of x, on y;…
A: one lag Yt may not be enough:
Q: 16.6 which type of graph would you recommend to show each of the following? why? A. A comparison of…
A: A. Since we want to compare the changes in the annual per capital income of two countries over a…
Q: Consider the following time series. Quarter Year 1 Year 2 Year 3 70 67 61 48 40 50 3 57 59 52 4 77…
A: As requested, I have solved the (b) and (c) part. Kindly refer to Step 2 and 3 for the solution.
Q: what are the differences between the following models? 1) Moving average models 2) Simple…
A: As per guidelines, we would provide only three sub-parts at a time. Please provide each question at…
Q: When testing the IFE (International Fisher Effect), we run a linear regression, R^2 could be used to…
A: Regression is used to measure the strength of the relationship between the one dependent and…
Q: Companies A and B are both U.S. companies with operations in Mexico. The regression equations…
A: Company A: PCFt= =0.032 -2.7et+μt Company B: PCFt=0.005+3.5et+μt
Q: Multiple linear regression Classification tree Logistic regression
A: It makes use of ancient facts to are expecting destiny events. There are many different sorts of…
Q: The quarterly sales in millions for Autoko Corporation, an automobile dealership company over the…
A: Seasonal factor helps to predict the future demand based on the past information while considering…
Q: The following multiple regression model was developedto predict job performance as measured by a…
A: The detailed solution for the given question is in Step 2.
Q: The total number of absents students in the four (4) school terms for a matric class at a high…
A: Find the Given details below: Given details: Year Term Number of Absents 2018 1 50 2 38 3…
Q: Cell phone sales for a California-based firm over the last 10 weeks are shown in the following…
A: Formula:
Q: Sales of Volkswagens have grown steadily at auto dealerships in Nevada during the past 5 years (see…
A: Tred projection or linear regression forecast is a method that uses the variation and trend in past…
Q: How efficient is an Regression analysis technique?
A: Relapse analysis or Regression analysis is a reliable method of distinguishing which factors affect…
Q: Given two independent random samples with the following results: n1=441 x1=185 n2=560 x2=351…
A: Below are the null and alternative Hypothesis,Null Hypothesis, H0: p1 = p2Alternate Hypothesis, Ha:…
Q: Consider the following hypothesis test: Ho: µ 2 45 Hạ: µ < 45 A sample of 36 is used. Identify the…
A: Given information Sample mean= 36 Hypothesis situation is H0:μ≥45 Ha:μ<45α = 0.01
Q: A small hospital is planning for future needs for Çovid 19. The data below show the number of cases…
A:
Q: Define Ogive 1 O A percent frequency distribution O A graph of a cumulative distribution A tabular…
A: Ogive: Ogive is defined as a frequency distribution graph based on discrete and…
Q: What are the advantages and disadvantages of Regression Model, Econometric Model, Driving Indicator…
A: 1. Regression Model Regression examination is a type of prescient demonstrating method which…
Q: Attendance at Orlando's newest Disneylike attraction, Lego World, has been as follows Quarter Winter…
A: To determine the Seasonal indices of the year by using formulae: Total attendance for the year =…
Q: The number of auto accidents in Athens, Ohio is related to the regional number of regisgtered…
A: Given values: Regression formula; y=a+b1X1+b2x2+b3X3 where, Y = number of automobile accidents a =…
Q: What type of pattern exists in the data? The time series plot shows an upward linear trend. The time…
A:
Q: Discuss how the coefficient of determination and the coefficient of correlation are related and how…
A: The intensity as well as direction of a linear connection between two variables (x and y) is indeed…


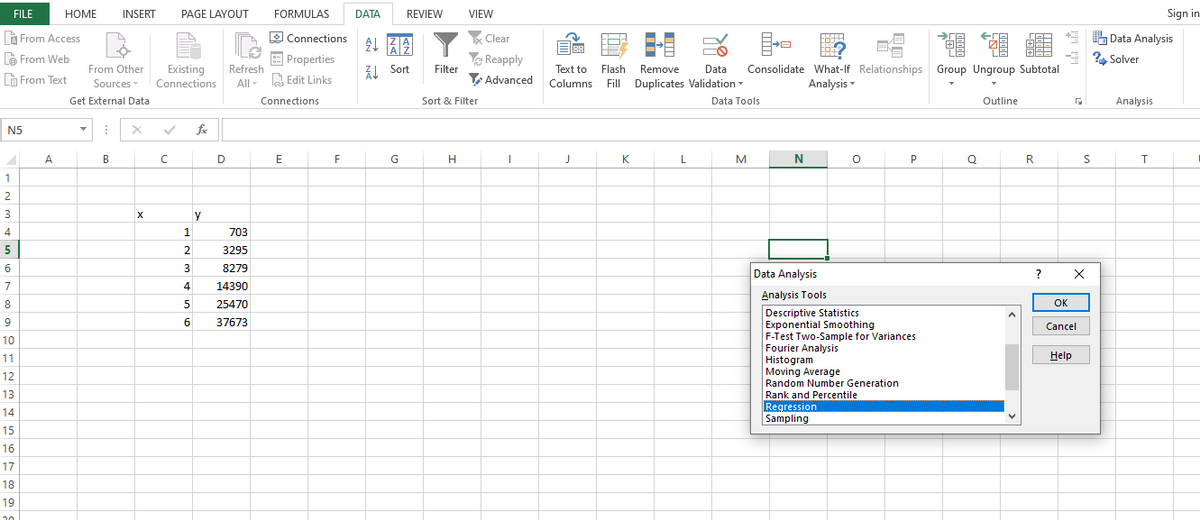
The linear regression equation can be determined using excel as follows:
Step 1: Put the data onto the spreadsheet
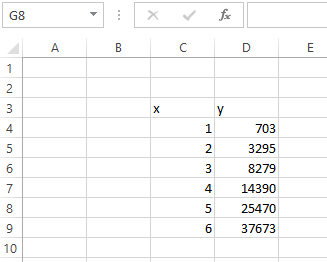
Step 2: Go to data --> data analysis --> regression

Step by step
Solved in 2 steps with 4 images


- A small computer chip manufacturer wants to forecast monthly ozperating costs as a function of the number of units produced during a month. The company has collected the 16 months of data in the file P13_34.xlsx. a. Determine an equation that can be used to predict monthly production costs from units produced. Are there any outliers? b. How could the regression line obtained in part a be used to determine whether the company was efficient or inefficient during any particular month?The management of a technology company is trying to determine the variable that best explains the variation of employee salaries using a sample of 52 full-time employees; see the file P13_08.xlsx. Estimate simple linear regression equations to identify which of the following has the strongest linear relationship with annual salary: the employees gender, age, number of years of relevant work experience prior to employment at the company, number of years of employment at the company, or number of years of post secondary education. Provide support for your conclusion.Stock market analysts are continually looking for reliable predictors of stock prices. Consider the problem of modeling the price per share of electric utility stocks (Y). Two variables thought to influence this stock price are return on average equity (X1) and annual dividend rate (X2). The stock price, returns on equity, and dividend rates on a randomly selected day for 16 electric utility stocks are provided in the file P13_15.xlsx. Estimate a multiple regression equation using the given data. Interpret each of the estimated regression coefficients. Also, interpret the standard error of estimate and the R-square value for these data.
- Management of a home appliance store would like to understand the growth pattern of the monthly sales of Blu-ray disc players over the past two years. Managers have recorded the relevant data in the file P13_33.xlsx. a. Create a scatterplot for these data. Comment on the observed behavior of monthly sales at this store over time. b. Estimate an appropriate regression equation to explain the variation of monthly sales over the given time period. Interpret the estimated regression coefficients. c. Analyze the estimated equations residuals. Do they suggest that the regression equation is adequate? If not, return to part b and revise your equation. Continue to revise the equation until the results are satisfactory.The owner of a restaurant in Bloomington, Indiana, has recorded sales data for the past 19 years. He has also recorded data on potentially relevant variables. The data are listed in the file P13_17.xlsx. a. Estimate a simple regression equation involving annual sales (the dependent variable) and the size of the population residing within 10 miles of the restaurant (the explanatory variable). Interpret R-square for this regression. b. Add another explanatory variableannual advertising expendituresto the regression equation in part a. Estimate and interpret this expanded equation. How does the R-square value for this multiple regression equation compare to that of the simple regression equation estimated in part a? Explain any difference between the two R-square values. How can you use the adjusted R-squares for a comparison of the two equations? c. Add one more explanatory variable to the multiple regression equation estimated in part b. In particular, estimate and interpret the coefficients of a multiple regression equation that includes the previous years advertising expenditure. How does the inclusion of this third explanatory variable affect the R-square, compared to the corresponding values for the equation of part b? Explain any changes in this value. What does the adjusted R-square for the new equation tell you?Suppose that a regional express delivery service company wants to estimate the cost of shipping a package (Y) as a function of cargo type, where cargo type includes the following possibilities: fragile, semifragile, and durable. Costs for 15 randomly chosen packages of approximately the same weight and same distance shipped, but of different cargo types, are provided in the file P13_16.xlsx. a. Estimate a regression equation using the given sample data, and interpret the estimated regression coefficients. b. According to the estimated regression equation, which cargo type is the most costly to ship? Which cargo type is the least costly to ship? c. How well does the estimated equation fit the given sample data? How might the fit be improved? d. Given the estimated regression equation, predict the cost of shipping a package with semifragile cargo.
- The file P13_26.xlsx contains the monthly number of airline tickets sold by the CareFree Travel Agency. a. Create a time series chart of the data. Based on what you see, which of the exponential smoothing models do you think will provide the best forecasting model? Why? b. Use simple exponential smoothing to forecast these data, using a smoothing constant of 0.1. c. Repeat part b, but search for the smoothing constant that makes RMSE as small as possible. Does it make much of an improvement over the model in part b?Do the sales prices of houses in a given community vary systematically with their sizes (as measured in square feet)? Answer this question by estimating a simple regression equation where the sales price of the house is the dependent variable, and the size of the house is the explanatory variable. Use the sample data given in P13_06.xlsx. Interpret your estimated equation, the associated R-square value, and the associated standard error of estimate.A trucking company wants to predict the yearly maintenance expense (Y) for a truck using the number of miles driven during the year (X1) and the age of the truck (X2, in years) at the beginning of the year. The company has gathered the data given in the file P13_13.xlsx. Note that each observation corresponds to a particular truck. Estimate a multiple regression equation using the given data. Interpret each of the estimated regression coefficients. Also, interpret the standard error of estimate and the R-square value for these data.
- The file P13_28.xlsx contains monthly retail sales of U.S. liquor stores. a. Is seasonality present in these data? If so, characterize the seasonality pattern. b. Use Winters method to forecast this series with smoothing constants = = 0.1 and = 0.3. Does the forecast series seem to track the seasonal pattern well? What are your forecasts for the next 12 months?The file P13_42.xlsx contains monthly data on consumer revolving credit (in millions of dollars) through credit unions. a. Use these data to forecast consumer revolving credit through credit unions for the next 12 months. Do it in two ways. First, fit an exponential trend to the series. Second, use Holts method with optimized smoothing constants. b. Which of these two methods appears to provide the best forecasts? Answer by comparing their MAPE values.An antique collector believes that the price received for a particular item increases with its age and with the number of bidders. The file P13_14.xlsx contains data on these three variables for 32 recently auctioned comparable items. Estimate a multiple regression equation using the given data. Interpret each of the estimated regression coefficients. Is the antique collector correct in believing that the price received for the item increases with its age and with the number of bidders? Interpret the standard error of estimate and the R-square value for these data.