
Concept explainers
a)
1)
To determine: The system utilization rate.
Introduction: System utilization refers to percentage amount of capacity which is utilized or we can say that actual output is divided by potential output. It is operational metric for business which indicates aggregate productive capacity.
It reflects the ratio of demand to capacity or supply, it is also commonly known as Capacity utilization rate.
a)
1)
Answer to Problem 1P
Explanation of Solution
Given information:
Formula,
Where,
System utilization rate denoted by
Demand rate (measured as arrival) denoted by
Supply rate (measured as service) denoted by
Calculation of the system utilization:
Therefore, system utilization rate is 0.6000.
1)
To determine: The system utilization rate.
Introduction: System utilization refers to percentage amount of capacity which is utilized or we can say that actual output is divided by potential output. It is operational metric for business which indicates aggregate productive capacity.
It reflects the ratio of demand to capacity or supply, it is also commonly known as Capacity utilization rate.
1)
Answer to Problem 1P
Explanation of Solution
Given information:
Formula,
Where,
System utilization rate denoted by
Demand rate (measured as arrival) denoted by
Supply rate (measured as service) denoted by
Calculation of the system utilization:
Therefore, system utilization rate is 0.6000.
2)
To determine: The average number customers waiting for service in line.
2)
Answer to Problem 1P
Explanation of Solution
Explanation
Given information:
Formula as per single server model of average number customers waiting for service in line
Where,
Demand rate (measured as arrival) denoted by
Supply rate per server denoted by
Calculation of Average number of customers waiting in line (Lq):
Therefore, average number of customers waiting in line (Lq) is 0.9000.
3)
To determine: Average number of customers waiting time.
3)
Answer to Problem 1P
Explanation of Solution
Given information:
Formula as per single server model of average number customers waiting for service in line:
Where,
Demand rate (measured as arrival) denoted by
Calculation of Average number of customers waiting in line (
Therefore, average number customers waiting time (
b)
1)
To determine: The average number of customer waiting for repairs.
b)
1)
Answer to Problem 1P
Explanation of Solution
Given information:
Mean service time: 2 hours
M =1
Calculation of
Formula as per single server model of average number customers waiting for service in line:
Where,
Demand rate (measured as arrival) denoted by
Supply rate per server denoted by
Calculation of Average number of customers waiting in line (Lq):
Therefore, Average number of customers waiting in line (Lq) is 2.250.
1)
To determine: The average number of customer waiting for repairs.
1)
Answer to Problem 1P
Explanation of Solution
Given information:
Mean service time: 2 hours
M =1
Calculation of
Formula as per single server model of average number customers waiting for service in line:
Where,
Demand rate (measured as arrival) denoted by
Supply rate per server denoted by
Calculation of Average number of customers waiting in line (Lq):
Therefore, Average number of customers waiting in line (Lq) is 2.250.
2)
To determine: The system utilization rate.
Introduction: It reflects the ratio of demand to capacity or supply, it is also commonly known as Capacity utilization rate.
2)
Answer to Problem 1P
Explanation of Solution
Given information:
Formula,
Where,
System utilization rate denoted by
Demand rate (measured as arrival) denoted by
Supply rate (measured as service) denoted by
Calculation of the system utilization:
Therefore, system utilization rate is 0.750.
3)
To determine: The idle time.
3)
Answer to Problem 1P
Explanation of Solution
Calculation of the idle time:
Therefore, idle time per day per hours is 2hours per day.
4)
To determine: Probability of two or more customers in the system.
4)
Answer to Problem 1P
Explanation of Solution
Step 1: Calculate the probability of less than two:
Therefore, probability of less than two is 0.4375.
Step 2: Calculation probability of two or more than customer in the system:
Therefore, probability of less than two is 0.5625.
c)
1)
To determine: The system utilization rate.
c)
1)
Answer to Problem 1P
Explanation of Solution
Given information
Formula:
Where,
System utilization rate denoted by
Demand rate (measured as arrival) denoted by
Supply rate (measured as service) denoted by
Calculation of the system utilization:
Therefore, system utilization rate is 0.7500.
1)
To determine: The system utilization rate.
1)
Answer to Problem 1P
Explanation of Solution
Given information
Formula:
Where,
System utilization rate denoted by
Demand rate (measured as arrival) denoted by
Supply rate (measured as service) denoted by
Calculation of the system utilization:
Therefore, system utilization rate is 0.7500.
2)
To determine: Average number of customers in the system (Ls).
2)
Answer to Problem 1P
Explanation of Solution
Step 1: Calculation of the average number of customer served
Therefore average number of customer served is 1.5.
Step 2: find the value of
Given information:
Then, from Infinite-source values table we find that value for
For reference:
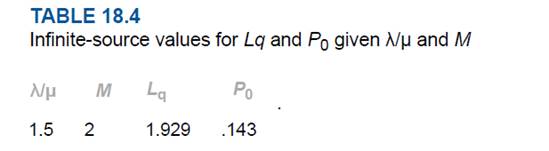
Step 3: Calculation of the average number of customers in the system (Ls)
Therefore, the average number of customers in the system (Ls) is 3.429.
3)
To determine: Average time customers wait in line for service (Wq).
3)
Answer to Problem 1P
Explanation of Solution
Therefore, the average time customers wait in line for service (Wq).is 0.107.
4)
To determine: The average waiting time for an arrival not immediately served (hours) (Wa).
4)
Answer to Problem 1P
Explanation of Solution
Calculation of average waiting time for an arrival not immediately served (hours) (Wa):
Therefore, average waiting time for an arrival not immediately served (hours) (Wa) is 0.167 hours.
Want to see more full solutions like this?
Chapter 18 Solutions
Operations Management


- Repair calls are handled by one repairman at a photocopy shop. Repair time, including travel time, is exponentially distributed, with a mean of two hours per call. Requests for copier repairs come in at a mean rate of three per eight-hour day (assume Poisson). Use Table 1. b. Determine system utilization. (Omit the "%" sign in your response.) System utilization %arrow_forwardWhich of the following is a main characteristic of operation when applied to a queuing system? Population None of the options are correct Service rate ✓ Average time spent waiting in the systemarrow_forwardλ = 3 Customers per hour μ = 5 Customers per hour M = 1 (a) What is the system utilization? (b) What is the average number of customers waiting for service? (c) What is the average time customers wait in line for service?arrow_forward
- Describe two examples of unethical behavior related to waiting line management, and state whichethical principles they violate.CRITICAL THINKINGEXERCISES1. a. λ = 3 customers/hourμ = 5 customers/hourM = 1(1) What is the system utilization?(2) What is the average number of customers waiting for service?(3) What is the average time customers wait in line for service? b. Repair calls are handled by one repairman at a photocopy shop. Repair time, including traveltime, is exponentially distributed, with a mean of two hours per call. Requests for copier repairscome in at a mean rate of three per eight-hour day (assume Poisson). Determine:(1) The average number of customers awaiting repairs.(2) System utilization.(3) The amount of time during an eight-hour day that the repairman is not out on a call.(4) The probability of two or more customers in the system.c. An average of 18 customers arrive at a service center each hour. There are two servers on duty,and each server can process 12…arrow_forward1. A single cashier handles customers that arrive at a bakery. About 34.8 customers come into the bakery per hour. It takes 73 seconds to serve each customer (standard time). 2. What is the utilization of the cashier?What is the probability there are no customers in line or at the cashier? 3. What is the probability there are less than 2 customers waiting? Note:- Do not provide handwritten solution. Maintain accuracy and quality in your answer. Take care of plagiarism. Answer completely. You will get up vote for sure.arrow_forwardIn an M/MA queueing system, the arrival rate is 4 customers per hour and the service rate is 6 customers per hour. If the service process is automated (resulting in no variation in service times but the same service rate), what will be the resulting performance measurements? (Round your answers to 3 decimal places.) a. What is the utilization? Utilization b. What is the expected number of customers in the system (L)? Number of customers c. What is the expected waiting time (in hours) for the system (W)? Waiting time(in hours) d. What is the expected number of customers in the queue(La)? < Prev 2 of 5 Next raw lillarrow_forward
- Please do not give solution in image format thanku A bank has an average of 10 customers per hour arriving into the system, and it takes an average of 30 minutes for the clerk to complete a transaction with a customer. What is the average length of the queue in the bank? And A store open 24 hours per day is interested in determining store traffic. It found that customers arrive uniformly at the rate of 10 customers per hour. The store has a single worker to process customers. The worker takes an average of 5 minutes to process a customer. If we assume that every customer must be processed, what is the average number of customers in the store?arrow_forwardIn short, define three cases in which the first-in, first-out (FIFO) concept in queuing analytics is not valid.arrow_forward
 Practical Management ScienceOperations ManagementISBN:9781337406659Author:WINSTON, Wayne L.Publisher:Cengage,