
Concept explainers
Videos
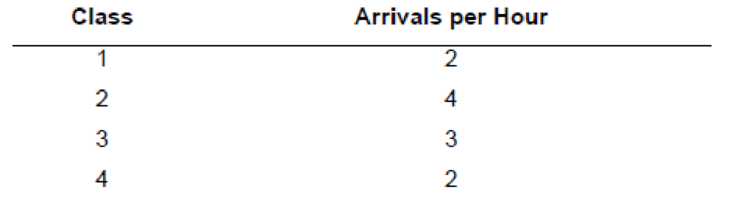
A priority waiting system assigns arriving customers to one of four classes. Arrival rates (Poisson) of the classes are shown in the following table. Five servers process the customers, and each can handle three customers per hour.
a. What is the system utilization?
b. What is the average wait for service by customers in the various classes? How many are waiting in each class, on average?
c. If the arrival rate of the second priority class could be reduced to three units per hour by shifting some arrivals into the third priority class, how would your answers to part b change?
d. What observations can you make based on your answers to part c?
a)
To determine: System utilization rate.
Introduction: Poisson distribution is utilized to ascertain the probability of an occasion happening over a specific time period or interval. The interval can be one of time, zone, volume or separation. The probability of an event happening is discovered utilizing the equation in the Poisson distribution.
Answer to Problem 16P
Explanation of Solution
Given Information:
It is given that the processing time is 3 customers per hour and there are 5 servers to process the customers.
| Class | Arrivals per Hour |
| 1 | 2 |
| 2 | 4 |
| 3 | 3 |
| 4 | 2 |
Calculate the system utilization:
It is calculated by adding all the total customer hours for each class and the result is divided with number of servers and customer process per hour.
Here,
M = number of servers
Hence the system utilization is 0.7333.
b)
To determine: The average customer waiting for service for each class and waiting in each class on average.
Answer to Problem 16P
Explanation of Solution
Given Information:
It is given that the processing time is 3 customers per hour and there are 5 servers to process the customers.
| Class | Arrivals per Hour |
| 1 | 2 |
| 2 | 4 |
| 3 | 3 |
| 4 | 2 |
Calculate the average number of customers:
It is calculated by dividing the total customers arrive per hour with customer process per hour.
Here,
r = average number of customers
Calculate average number of customers waiting for service (Lq) using infinite-source table values for
The Lq values for
Calculate A using Formula 18-16 from book:
It is calculated by subtracting 1 minus system utilization rate and multiplying the result with Lq, the whole result is divided by total customer arrival rate.
Here,
Lq = average number of customers waiting for service
Calculate B using Formula 18-17 from book for each category
It is calculated by multiplying number of servers with customer service process rate per hour and the result is divided by total customer arrival rate for each category.
Here,
M = number of servers
Calculate the average waiting time for class 1 and class 2
It is calculated by multiplying A with B0 and B1, the result is divided by 1.
Calculate the average number of customers that are waiting for service for class 1 and class 2:
It is calculated by multiplying total customer arrival rate with average waiting time for units in each category.
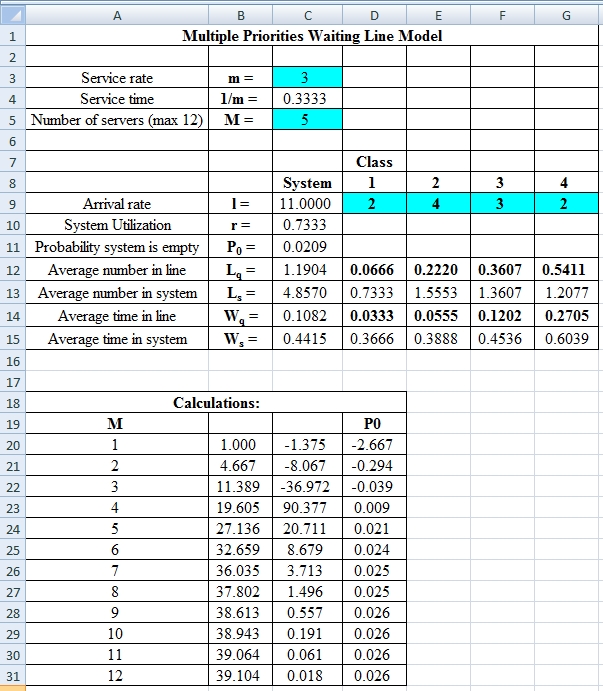
Excel Spreadsheet:
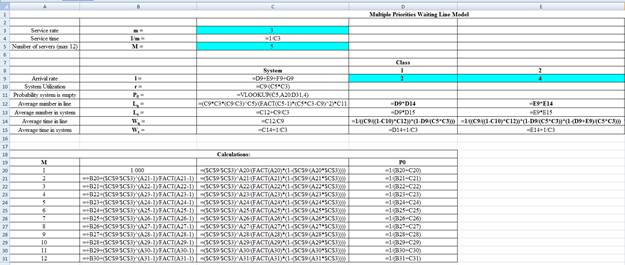
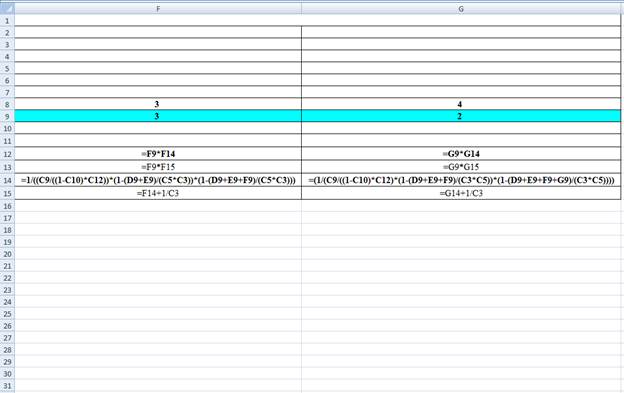
Excel Workings:
Hence the average wait time for service by customers for class 1 is 0.0333 hours, class 2 is 0.0555 hours, class 3 is 0.1202 hours and class 4 is 0.2705 hours. The waiting in each class on average for class 1 is 0.0666 customers, class 2 is 0.2220 customers, class 3 is 0.3607 customers and class 4 is 0.5411 customers.
c)
To determine: The average customer waiting for service for each class and waiting in each class on average.
Answer to Problem 16P
Explanation of Solution
Given Information:
It is given that the processing time is 3 customers per hour and there are 5 servers to process the customers. The second priority class is reduced to 3 units per hour by shifting some into the third party class. The arrival rate is as follows,
| Class | Arrivals per Hour |
| 1 | 2 |
| 2 | 3 |
| 3 | 4 |
| 4 | 2 |
Calculate the average number of customers
It is calculated by dividing the total customers arrive per hour with customer process per hour.
Here,
r = average number of customers
Calculate average number of customers waiting for service (Lq) using infinite-source table values for
The Lq values for
Calculate A using Formula 18-16 from book:
It is calculated by subtracting 1 minus system utilization rate and multiplying the result with Lq, the whole result is divided by total customer arrival rate.
Here,
Lq = average number of customers waiting for service
Calculate B using Formula 18-17 from book for each category
It is calculated by multiplying number of servers with customer service process rate per hour and the result is divided by total customer arrival rate for each category.
Here,
M = number of servers
Calculate the average waiting time for class 1 and class 2
It is calculated by multiplying A with B0 and B1, the result is divided by 1.
Calculate the average number of customers that are waiting for service for class 1 and class 2:
It is calculated by multiplying total customer arrival rate with average waiting time for units in each category.
Excel Spreadsheet:
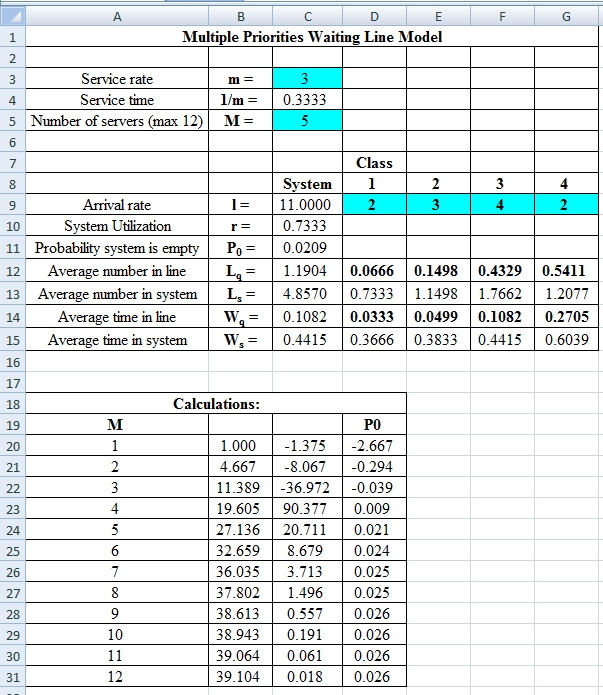
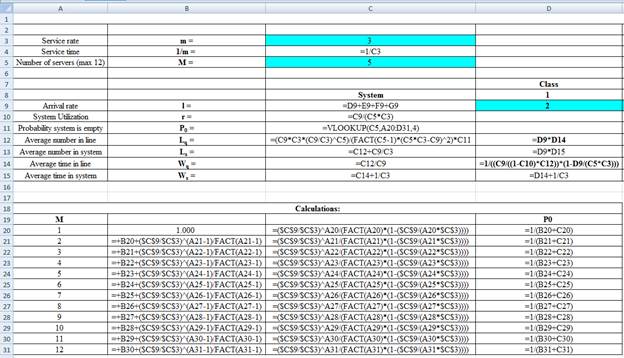
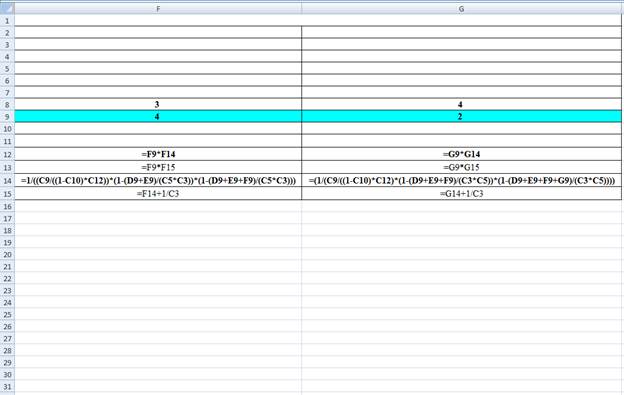
Excel Workings:
Hence the average wait time for service by customers for class 1 is 0.0333 hours, class 2 is 0.0499 hours, class 3 is 0.1082 hours and class 4 is 0.2705 hours. The waiting in each class on average for class 1 is 0.0666 customers, class 2 is 0.1498 customers, class 3 is 0.4329 customers and class 4 is 0.5411 customers.
d)
To determine: The observations based on the results from part c.
Answer to Problem 16P
Explanation of Solution
Calculate the change in average wait time for each class.
It is calculated by subtracting the final answer for average wait time for service by customers from part b with the final answer for average wait time for service by customers from part c.
The above results suggest that there is a decrease in average wait time for class 2 and class 3. Class 1 and 4 remains constant.
Calculate the change in average number waiting for each class.
It is calculated by subtracting the final answer for waiting on average from part b with the final answer for waiting on average from part c.
The above results suggest that there is a decrease in average waiting for class 2 and an increase in class 3. Class 1 and 4 remains constant.
Want to see more full solutions like this?
Chapter 18 Solutions
Operations Management


 Practical Management ScienceOperations ManagementISBN:9781337406659Author:WINSTON, Wayne L.Publisher:Cengage,
 MarketingMarketingISBN:9780357033791Author:Pride, William MPublisher:South Western Educational Publishing