
Concept explainers
Videos
For Problems 3-6, use appropriate multiple regression software of your choice and enter the data. Note that the data are also available for download at the Companion Sites for this text.
4. Education: Exam Scores Professor Gill has taught general psychology for many years. During the semester, she gives three multiple-choice exams, each worth 100 points. At the end of the course, Dr. Gill gives a comprehensive final worth 200 points. Let x1, x2, and x3 represent a student’s scores on exams 1, 2, and 3, respectively. Let x4 represent the student’s score on the final exam. Last semester Dr. Gill had 25 students in her class. The student exam scores are shown on the next page.
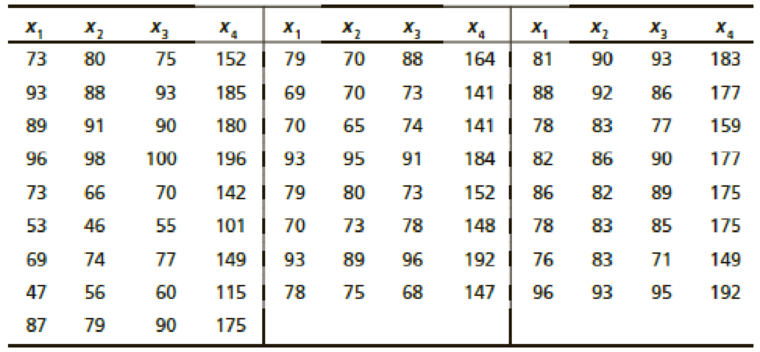
Since Professor Gill has not changed the course much from last semester to the present semester, the preceding data should be useful for constructing a regression model that describes this semester as well.
- (a) Generate summary statistics, including the
mean and standard deviation of each variable. Compute the coefficient of variation (see Section 3.2) for each variable. Relative to its mean, would you say that each exam had about the same spread of scores? Most professors do not wish to give an exam that is extremely easy or extremely hard. Would you say that all of the exams were about the same level of difficulty? (Consider both means and spread of test scores.) - (b) For each pair of variables, generate the sample
correlation coefficient r. Compute the corresponding coefficient of determination r2 Of the three exams 1,2, and 3, which do you think had the most influence on the final exam 4? Although one exam had more influence on the final exam, did the other two exams still have a lot of influence on the final? Explain each answer. - (c) Perform a regression analysis with x4 as the response variable. Use x1 x2, and x3 as explanatory variables. Look at the coefficient of multiple determination. What percentage of the variation in x4 can be explained by the corresponding variations in x1 x2, and x3 taken together?
- (d) Write out the regression equation. Explain how each coefficient can be thought of as a slope. If a student were to study "extra hard" for exam 3 and increase his or her score on that exam by 10 points, what corresponding change would you expect on the final exam? (Assume that exams I and 2 remain "fixed" in their scores.)
- (e) Test each coefficient in the regression equation to determine if it is zero or not zero. Use level of significance 5%. Why would the outcome of each hypothesis test help us decide whether or not a given variable should be used in the regression equation?
- (f) Find a 90% confidence interval for each coefficient.
- (g) This semester Susan has scores of 68, 72, and 75 on exams 1, 2, and 3, respectively. Make a prediction for Susan’s score on the final exam and find a 90% confidence interval for your prediction (if your software supports prediction intervals).
Want to see the full answer?
Check out a sample textbook solution
Chapter 9 Solutions
Understandable Statistics: Concepts and Methods


- Demand for Candy Bars In this problem you will determine a linear demand equation that describes the demand for candy bars in your class. Survey your classmates to determine what price they would be willing to pay for a candy bar. Your survey form might look like the sample to the left. a Make a table of the number of respondents who answered yes at each price level. b Make a scatter plot of your data. c Find and graph the regression line y=mp+b, which gives the number of respondents y who would buy a candy bar if the price were p cents. This is the demand equation. Why is the slope m negative? d What is the p-intercept of the demand equation? What does this intercept tell you about pricing candy bars? Would you buy a candy bar from the vending machine in the hallway if the price is as indicated. Price Yes or No 50 75 1.00 1.25 1.50 1.75 2.00arrow_forwardWhat is interpolation when using a linear model?arrow_forward
 Calculus For The Life SciencesCalculusISBN:9780321964038Author:GREENWELL, Raymond N., RITCHEY, Nathan P., Lial, Margaret L.Publisher:Pearson Addison Wesley,
 Algebra and Trigonometry (MindTap Course List)AlgebraISBN:9781305071742Author:James Stewart, Lothar Redlin, Saleem WatsonPublisher:Cengage Learning
 Algebra & Trigonometry with Analytic GeometryAlgebraISBN:9781133382119Author:SwokowskiPublisher:Cengage
 Glencoe Algebra 1, Student Edition, 9780079039897...AlgebraISBN:9780079039897Author:CarterPublisher:McGraw Hill
 Functions and Change: A Modeling Approach to Coll...AlgebraISBN:9781337111348Author:Bruce Crauder, Benny Evans, Alan NoellPublisher:Cengage Learning