
Videos
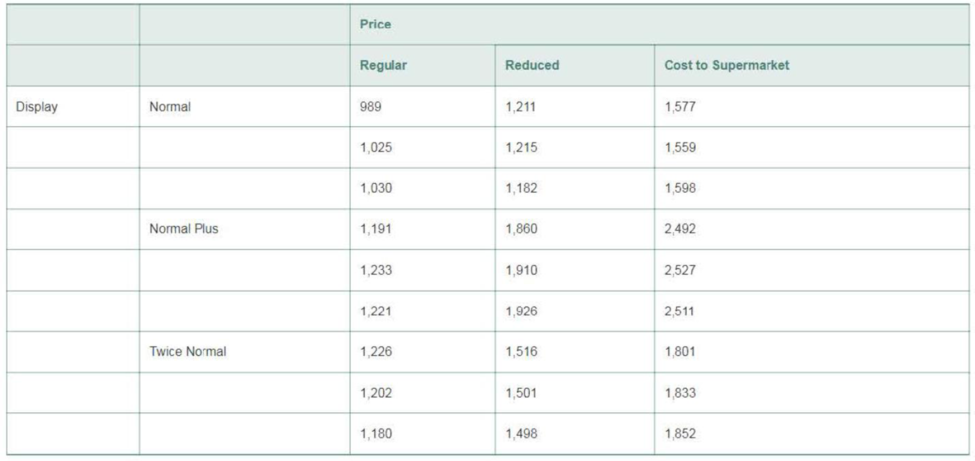
Testing the effectiveness of supermarket sales strategies. Factorial designs are commonly employed in marketing research to evaluate the effectiveness of sales strategies. At one supermarket, two of the factors were price level (regular, reduced price, cost to supermarket) and Display level (normal display space, normal display space plus end-of-aisle display, twice the normal display space). A 3 × 3 complete factorial design was employed, where each treatment was applied three times to a particular product at a particular supermarket. The dependent variable of interest was unit sales for the week. (To minimize treatment carryover effects, each treatment was preceded and followed by a week in which the product was priced at its regular price and was displayed in its normal manner.) The next table reports the data collected.
- a. How many treatments are considered in this study?
- b. Do the data indicate that the
mean sales differ among the treatments? Test using α = .10. - c. Is the test of interaction between the factors price and Display warranted as a result of the test in part b? If so. conduct the test using α = .10.
- d. Are the tests of the main effects for Price and Display warranted as a result of the previous tests? If so, conduct them using α = .10.
- e. Which pairs of treatment means should be compared as a result of the tests in parts b-d?
Want to see the full answer?
Check out a sample textbook solution
Chapter 9 Solutions
Statistics for Business and Economics (13th Edition)


- A real estate major collected information on some recent local home sales. The first 6 lines of the database appear in the accompanying table. The columns correspond to the house identification number, the community name, the zip code, the number of acres of the property, the year the house was built, the market value, and the size of the living area (in square feet). Do the data appear to have come from a designed survey or experiment? What concerns might you have about drawing conclusions from this data set? E Click the icon to view the data table. Do the data appear to have come from a designed survey or experiment? O A. It is not clear if the data were obtained from an experiment. They are certainly not from a survey. O B. It is not clear if the data were obtained from a survey. They are certainly not from an experiment. O C. It is not clear if the data were obtained from a survey or an experiment. O D. The data were certainly not obtained from survey or an experiment. What…arrow_forwardA retailer wants to see if a red "Sale" sign brings in less revenue than the same "Sale" sign in blue. The data below shows the revenue in thousands of dollars that was achieved for various days when the retailer decided to put the red "Sale" sign up and days when the retailer decided to put the blue "Sale" sign up. Red: 2.6, 3.2, 3.4, 1, 2.6, 4.6, 2.7, 3.3, 3.2, 2.4 Blue: 3.7, 4.6, 4.2, 4.1, 3.6, 2.1, 4.7, 3.6 Assume that both populations follow a normal distribution. What can be concluded at the α = 0.05 level of significance level of significance? For this study, we should use? The null and alternative hypotheses would be: H0: (please enter a decimal) H1: (Please enter a decimal) The test statistic = (please show your answer to 3 decimal places.) The p-value = (Please show your answer to 4 decimal places.) The p-value is ? α Based on this, we should ? the null hypothesis. Thus, the final conclusion…arrow_forwardA college president wanted to know how 10-year-after-graduation salaries for academic majors (English, psychology, math, etc.) compared to salaries for career-oriented majors (business, engineering, computer science, etc.). She matched 84 academic majors at her college with 84 career-oriented majors on the basis of SAT scores and GPA. She found MAcademic = $59,250, MCareer =$61,000, sD = 9,500. Check the assumptions 1. Random samples (robust) 2. Independence of observations (not robust) 3. Normality (robust)arrow_forward
- A retailer wants to see if a red "Sale" sign brings in less revenue than the same "Sale" sign in blue. The data below shows the revenue in thousands of dollars that was achieved for various days when the retailer decided to put the red "Sale" sign up and days when the retailer decided to put the blue "Sale" sign up. Red: 2.1, 3.6, 3.5, 2.5, 2, 3, 2.6, 2.6, 2, 3, 2.7 Blue: 2.6, 4.5, 4.1, 5, 4.6, 2.8, 3.9, 4.8 Assume that both populations follow a normal distribution. What can be concluded at the a = 0.10 level of significance level of significance? For this study, we should use Select an answer a. The null and alternative hypotheses would be: Но Select an answer V (please enter a decimal) Ho: Select an answer V Select an answer V H (Please enter a decimal) Select an answer Y Select an aNSwer V Select an answer b. The test statistic ?v = (please show your answer to 3 decimal places.) с. The p-valuе (Please show your answer to 4 decimal places.) d. The p-value is ?V a e. Based on this, we…arrow_forwardA retailer wants to see if a red "Sale" sign brings in more revenue than the same "Sale" sign in blue. The data below shows the revenue in thousands of dollars that was achieved for various days when the retailer decided to put the red "Sale" sign up and days when the retailer decided to put the blue "Sale" sign up. Red: 2.7, 2.6, 1.1, 4.2, 2.6, 3.4, 2.3, 2.9, 4, 2.6 Blue: 2.2, 1, 2.8, 1.6, 0.6, 0.9, 1, 1.7, 3.4 Assume that both populations follow a normal distribution. What can be concluded at the a = 0.01 level of significance level of significance? b. The test statistic t î = (please show your answer to 3 decimal places.) c. The p-value = (Please show your answer to 4 decimal places.)arrow_forwardAt the Carnival game, there are three 1 dollar bills, one 5 dollar bill, and one 10 dollar bill in a bag. It's five dollars to play, and whichever bill you grab from the bag is the one you keep. Say you draw 20 times with the following data: $5, $1, $1, $10, $1, $1, $5, $1, $1, $5, $10, $1, $1, $1, $1, $5, $1, $1, $10, $5 What is the expected value?arrow_forward
- A retailer wants to see if a red "Sale" sign brings in more revenue than the same "Sale" sign in blue. The data below shows the revenue in thousands of dollars that was achieved for various days when the retailer decided to put the red "Sale" sign up and days when the retailer decided to put the blue "Sale" sign up. Red: 3.4, 0.9, 4.1, 4.4, 4.5, 3.9, 2.6, 1.9, 3.5 Blue: 3.2, 2.7, 1.3, 1.4, 2.4, 2.5, 2.9, 1.8, 1.9 Assume that both populations follow a normal distribution. What can be concluded at the αα = 0.01 level of significance level of significance? The test statistic t = (please show your answer to 3 decimal places.) The p-value = (Please show your answer to 4 decimal places.)arrow_forwardA college president wanted to know how 10-year-after-graduation salaries for academic majors (English, psychology, math, etc.) compared to salaries for careeroriented majors (business, engineering, computer science, etc.). She matched 84 academic majors at her college with 84 career-oriented majors on the basis of SAT scores and GPA. She found MAcademic = $59,250, MCareer =$61,000, sD = 9,500. Use an alpha of .05 and a two-tailed test to determine if there is a difference in salaries.arrow_forwardA small coffee shop sells freshly squeezed juices in a refrigerated unit with slots where juice is displayed. These slots are called facings. The manager of the coffee shop suspects that the distribution of juice sales is different than the distribution of facings for each type of juice, so the manager records the sales of each juice over a two-week period. The proportion of facings and the sales for each type of juice are shown in the tables. Does the coffee shop owner have sufficient evidence to conclude that the distribution of sales is proportional to the number of facings at a 5 percent level of significance? Conduct the appropriate statistical test to support your conclusion.arrow_forward
- A retailer wants to see if a red "Sale" sign brings in more revenue than the same "Sale" sign in blue. The data below shows the revenue in thousands of dollars that was achieved for various days when the retailer decided to put the red "Sale" sign up and days when the retailer decided to put the blue "Sale" sign up. Red: 3.7, 3.9, 2.7, 3.6, 2.5, 2.8, 3.2, 4.4, 3.9 Blue: 1, 2.1, 2, 3, 2.8, 3.1, 2.5, 3.4, 3.6 Assume that both populations follow a normal distribution. What can be concluded at the � = 0.05 level of significance level of significance?arrow_forwardA survey of a random sample in an amusement park showed an average expenditure of $10.30 for the evening. The average expenditure for the 20 girls in the sample was $9.70 and for the boys it was $11.10. How many boys are there in the random sample?arrow_forwardA retailer wants to see if a red "Sale" sign brings in the same amount of revenue than the same "Sale" sign in blue. The data below shows the revenue in thousands of dollars that was achieved for various days when the retailer decided to put the red "Sale" sign up and days when the retailer decided to put the blue "Sale" sign up. Red: 2.4, 3, 3.6, 1.8, 3, 2.7, 2.9, 3, 3.1 Blue: 1.7, 2.1, 1.4, 2.6, 0.6, 3, 3.5, 1.6, 0.3 Assume that both populations follow a normal distribution. What can be concluded at the αα = 0.05 level of significance level of significance? The test statistic ? t = _______________ (please show your answer to 3 decimal places.) The p-value = __________________ (Please show your answer to 4 decimal places.)arrow_forward
 Glencoe Algebra 1, Student Edition, 9780079039897...AlgebraISBN:9780079039897Author:CarterPublisher:McGraw Hill
 Holt Mcdougal Larson Pre-algebra: Student Edition...AlgebraISBN:9780547587776Author:HOLT MCDOUGALPublisher:HOLT MCDOUGAL