Hypothesis Testing Using a P -Value In Exercises 31–36, (a) identify the claim and state H 0 and H a . (b) find the standardized test statistic z. (c) find the corresponding P-value. (d) decide whether to reject or fail to reject the null hypothesis. (e) interpret the decision in the context of the original claim. 36. Salaries An analyst claims that the mean annual salary for intermediate level architects in Wichita, Kansas, is more than the national mean, $52,000. The annual salaries (in dollars) for a random sample of 21 intermediate level architects in Wichita are listed. Assume the population is normally distributed and the population standard deviation is $8000. At α = 0.09, is there enough evidence to support the analyst’s claim? (Adapted from Salary.com)
Hypothesis Testing Using a P -Value In Exercises 31–36, (a) identify the claim and state H 0 and H a . (b) find the standardized test statistic z. (c) find the corresponding P-value. (d) decide whether to reject or fail to reject the null hypothesis. (e) interpret the decision in the context of the original claim. 36. Salaries An analyst claims that the mean annual salary for intermediate level architects in Wichita, Kansas, is more than the national mean, $52,000. The annual salaries (in dollars) for a random sample of 21 intermediate level architects in Wichita are listed. Assume the population is normally distributed and the population standard deviation is $8000. At α = 0.09, is there enough evidence to support the analyst’s claim? (Adapted from Salary.com)
Hypothesis Testing Using a P-ValueIn Exercises 31–36,
(a) identify the claim and state H0 and Ha.
(b) find the standardized test statistic z.
(c) find the corresponding P-value.
(d) decide whether to reject or fail to reject the null hypothesis.
(e) interpret the decision in the context of the original claim.
36. Salaries An analyst claims that the mean annual salary for intermediate level architects in Wichita, Kansas, is more than the national mean, $52,000. The annual salaries (in dollars) for a random sample of 21 intermediate level architects in Wichita are listed. Assume the population is normally distributed and the population standard deviation is $8000. At α = 0.09, is there enough evidence to support the analyst’s claim? (Adapted from Salary.com)
Features Features Normal distribution is characterized by two parameters, mean (µ) and standard deviation (σ). When graphed, the mean represents the center of the bell curve and the graph is perfectly symmetric about the center. The mean, median, and mode are all equal for a normal distribution. The standard deviation measures the data's spread from the center. The higher the standard deviation, the more the data is spread out and the flatter the bell curve looks. Variance is another commonly used measure of the spread of the distribution and is equal to the square of the standard deviation.
Nominal Data. In Exercises 9–12, use the sign test for the claim involving nominal data.
Births A random sample of 860 births in New York State included 426 boys and 434 girls. Use a 0.05 significance level to test the claim that when babies are born, boys and girls are equally likely.
Chapter 7 Solutions
Elementary Statistics: Picturing the World (7th Edition)
Basic Business Statistics, Student Value Edition (13th Edition)
Knowledge Booster
Learn more about
Need a deep-dive on the concept behind this application? Look no further. Learn more about this topic, statistics and related others by exploring similar questions and additional content below.
Hypothesis Testing - Solving Problems With Proportions; Author: The Organic Chemistry Tutor;https://www.youtube.com/watch?v=76VruarGn2Q;License: Standard YouTube License, CC-BY
Hypothesis Testing and Confidence Intervals (FRM Part 1 – Book 2 – Chapter 5); Author: Analystprep;https://www.youtube.com/watch?v=vth3yZIUlGQ;License: Standard YouTube License, CC-BY

 36. Salaries An analyst claims that the
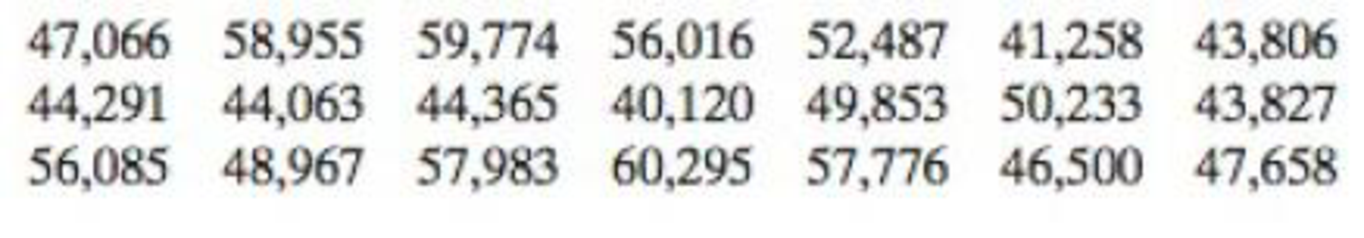


 Glencoe Algebra 1, Student Edition, 9780079039897...AlgebraISBN:9780079039897Author:CarterPublisher:McGraw Hill
 Big Ideas Math A Bridge To Success Algebra 1: Stu...AlgebraISBN:9781680331141Author:HOUGHTON MIFFLIN HARCOURTPublisher:Houghton Mifflin Harcourt
 Holt Mcdougal Larson Pre-algebra: Student Edition...AlgebraISBN:9780547587776Author:HOLT MCDOUGALPublisher:HOLT MCDOUGAL