Videos
Agnew Manufacturing produces and sells three models of a single product, Standard, Superior, and DeLuxe, in a local market and in a regional market. At the end of the first quarter of the current year, the following income statement (in thousands of dollars) has been prepared:
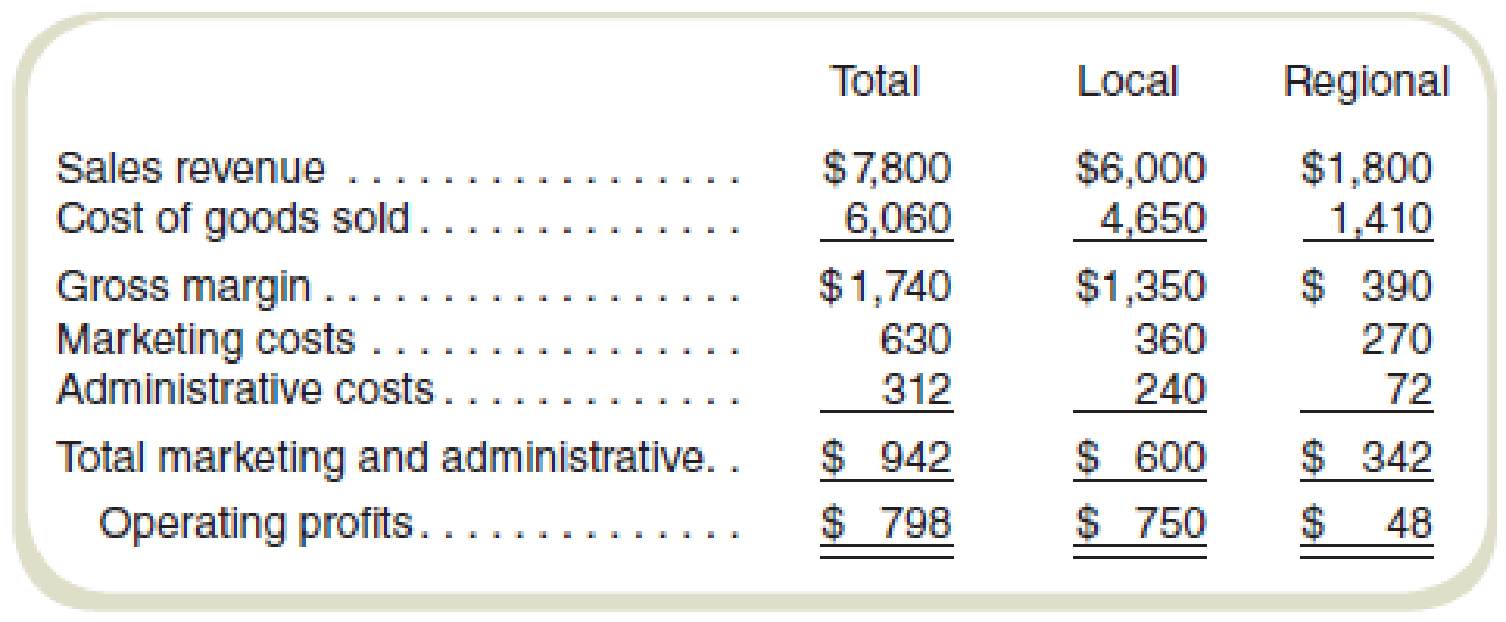
Management has expressed special concern with the regional market because of the extremely poor return on sales. This market was entered a year ago because of excess capacity. It was originally believed that the return on sales would improve with time, but after a year, no noticeable improvement can be seen from the results as reported in the preceding quarterly statement.
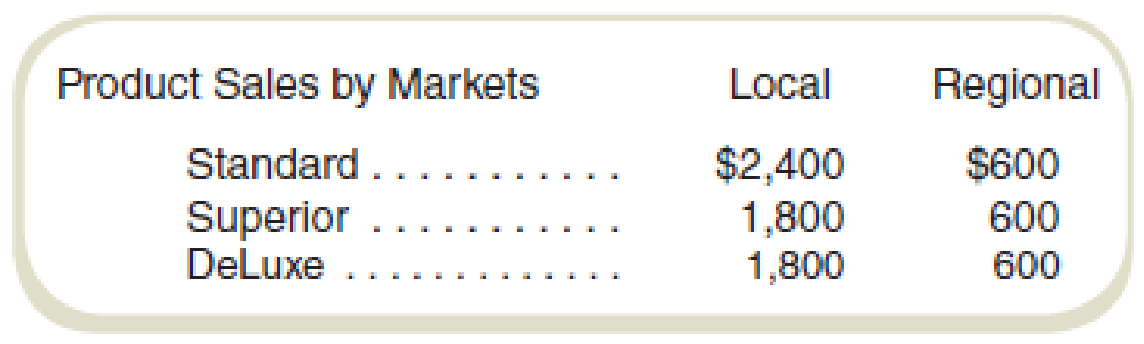
In attempting to decide whether to eliminate the regional market, the following information has been gathered:
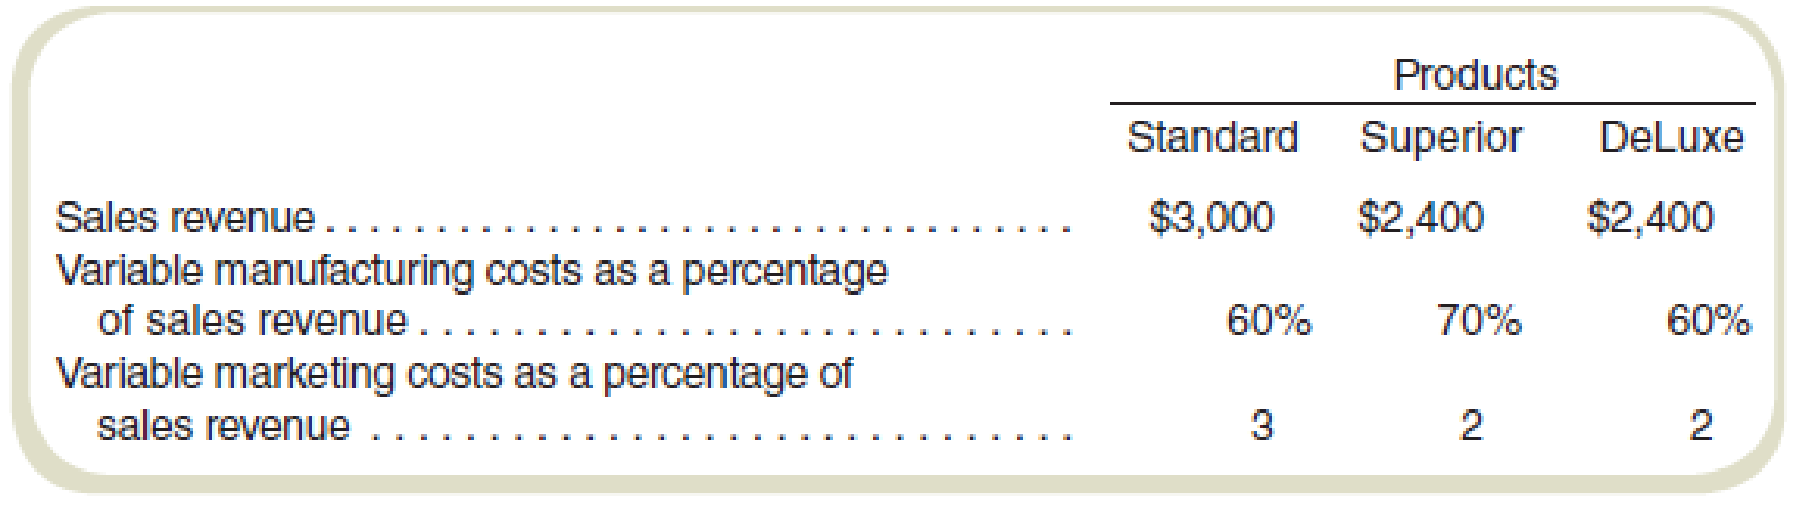
All administrative costs and fixed
Required
- a. Assuming there are no alternative uses for Agnew’s present capacity, would you recommend dropping the regional market? Why or why not?
- b. Prepare the quarterly income statement showing contribution margins by products. Do not allocate fixed costs to products.
- c. It is believed that a new model can be ready for sale next year if Agnew decides to go ahead with continued research. The new product would replace DeLuxe and can be produced by simply converting equipment presently used in producing the DeLuxe model. This conversion will increase fixed costs by $60,000 per quarter. What must be the minimum contribution margin per quarter for the new model to make the changeover financially feasible?
Want to see the full answer?
Check out a sample textbook solution
Chapter 4 Solutions
Fundamentals Of Cost Accounting (6th Edition)


- In 20x5, Major Company initiated a full-scale, quality improvement program. At the end of the year, Jack Aldredge, the president, noted with some satisfaction that the defects per unit of product had dropped significantly compared to the prior year. He was also pleased that relationships with suppliers had improved and defective materials had declined. The new quality training program was also well accepted by employees. Of most interest to the president, however, was the impact of the quality improvements on profitability. To help assess the dollar impact of the quality improvements, the actual sales and the actual quality costs for 20x4 and 20x5 are as follows by quality category: All prevention costs are fixed (by discretion). Assume all other quality costs are unit-level variable. Required: 1. Compute the relative distribution of quality costs for each year and prepare a pie chart. Do you believe that the company is moving in the right direction in terms of the balance among the quality cost categories? Explain. 2. Prepare a one-year trend performance report for 20x5 (compare the actual costs of 20x5 with those of 20x4, adjusted for differences in sales volume). How much have profits increased because of the quality improvements made by Major Company? 3. Estimate the additional improvement in profits if Major Company ultimately reduces its quality costs to 2.5 percent of sales revenues (assume sales of 10 million).arrow_forwardGagnon Company reported the following sales and quality costs for the past four years. Assume that all quality costs are variable and that all changes in the quality cost ratios are due to a quality improvement program. Required: 1. Compute the quality costs for all four years. By how much did net income increase from Year 1 to Year 2 because of quality improvements? From Year 2 to Year 3? From Year 3 to Year 4? 2. The management of Gagnon Company believes it is possible to reduce quality costs to 2.5 percent of sales. Assuming sales will continue at the Year 4 level, calculate the additional profit potential facing Gagnon. Is the expectation of improving quality and reducing costs to 2.5 percent of sales realistic? Explain. 3. Assume that Gagnon produces one type of product, which is sold on a bid basis. In Years 1 and 2, the average bid was 400. In Year 1, total variable costs were 250 per unit. In Year 3, competition forced the bid to drop to 380. Compute the total contribution margin in Year 3 assuming the same quality costs as in Year 1. Now, compute the total contribution margin in Year 3 using the actual quality costs for Year 3. What is the increase in profitability resulting from the quality improvements made from Year 1 to Year 3?arrow_forwardSuppose that Kicker had the following sales and cost experience (in thousands of dollars) for May of the current year and for May of the prior year: In May of the prior year, Kicker started an intensive quality program designed to enable it to build original equipment manufacture (OEM) speaker systems for a major automobile company. The program was housed in research and development. In the beginning of the current year, Kickers accounting department exercised tighter control over sales commissions, ensuring that no dubious (e.g., double) payments were made. The increased sales in the current year required additional warehouse space that Kicker rented in town. (Round ratios to four decimal places. Round sales dollars computations to the nearest dollar.) Required: 1. Calculate the contribution margin ratio for May of both years. 2. Calculate the break-even point in sales dollars for both years. 3. Calculate the margin of safety in sales dollars for both years. 4. CONCEPTUAL CONNECTION Analyze the differences shown by your calculations in Requirements 1, 2, and 3.arrow_forward
- Millard Corporation is a wholesale distributor of office products. It purchases office products from manufacturers and distributes them in the West, Central, and East regions. Each of these regions is about the same size and each has its own manager and sales staff. The company has been experiencing losses for many months. In an effort to improve performance, management has requested that the monthly income statement be segmented by sales region. The company's first effort at preparing a segmented income statement for May is given below. Sales Regional expenses (traceable): Cost of goods sold Advertising Salaries Utilities Depreciation Shipping expense Total regional expenses Regional income (loss) before corporate expenses Corporate expenses: Advertising (general) General administrative expense Total corporate expenses Net operating income (loss) Variable expenses: Total variable expenses Traceable fixed expenses: Total traceable fixed expenses Common fixed expenses: Total common…arrow_forwardMillard Corporation is a wholesale distributor of office products. It purchases office products from manufacturers and distributes them in the West, Central, and East regions. Each of these regions is about the same size and each has its own manager and sales staff. The company has been experiencing losses for many months. In an effort to improve performance, management has requested that the monthly income statement be segmented by sales region. The company’s first effort at preparing a segmented income statement for May is given below. Sales Region West Central East Sales $ 311,000 $ 796,000 $ 703,000 Regional expenses (traceable): Cost of goods sold 94,000 240,000 312,000 Advertising 105,000 236,000 240,000 Salaries 54,000 54,000 107,000 Utilities 8,700 16,100 13,600 Depreciation 21,000 35,000 28,000 Shipping expense 17,000 31,000 36,000 Total regional expenses 299,700 612,100 736,600 Regional income (loss) before corporate expenses 11,300…arrow_forwardMillard Corporation is a wholesale distributor of office products. It purchases office products from manufacturers and distributes them in the West, Central, and East regions. Each of these regions is about the same size and each has its own manager and sales staff. The company has been experiencing losses for many months. In an effort to improve performance, management has requested that the monthly income statement be segmented by sales region. The company's first effort at preparing a segmented income statement for May is given below. Sales Regional expenses (traceable): Cost of goods sold Advertising Salaries Utilities Depreciation Shipping expense Total regional expenses Regional income (loss) before corporate expenses Corporate expenses: Advertising (general) General administrative expense Total corporate expenses Net operating income (loss) Variable expenses: Total variable expenses Traceable fixed expenses: Total traceable fixed expenses Common fixed expenses: Total common…arrow_forward
- The division manager of Division B received the following operating income data for the past year: The manager of the division is surprised that the T205 product line is not profitable. The division accountant estimates that dropping the T205 product line will decrease fixed cost of goods sold by $75,000 and decrease fixed selling and administrative expenses by $10,000. Prepare a differential analysis to show whether Division B should drop the T205 product line. What is your recommendation to the manager of Division B?arrow_forwardOne Manila Inc.'s president, Zane Cruz, is concerned about the prospects of one of the firm's major products. The president has been reviewing a marketing report with Jom Lara, marketing product manager, for their top-of-the-line stereo amplifier. The report indicates another price reduction is needed to meet anticipated competitors' reduction in sales prices. The current selling price for OMI's amplifier is P35,000 per unit. It is expected that within three months OMI's two major competitors will be selling their comparable amplifiers for P30,000 per unit. This concerns CRUZ because OMI's current cost of producing the amplifiers is P31,500, which yields a P3,500 profit on each unit sold. The situation is especially disturbing because OMI had implemented an activity-based costing (ABC) system about two years ago. The ABC system helped them better identify costs, cost pools, cost drivers, and cost reduction opportunities. Changes made when adopting ABC reduced costs on this…arrow_forwardThe managers of Lessing Toy & Hobby (LTH) have decided to keep the stores in the Northern Division open, in spite of the dwindling demand in the area. They want to forecast what the income will be in the coming year, using the income statement as the base. The cost analyst at LTH estimates sales in the coming year will only be 85 percent of the current year sales. Cost of goods sold is estimated to be 90 percent of the current year. The managers have decided to increase advertising next year by 10 percent above the current year, but will cut administrative salaries in the Northern Division by 30 percent. They also expect to lower rent and occupancy costs by 15 percent. Allocated corporate overhead, based on information from the CFO, is expected to be $1.2 million. Required: Prepare an income statement for Year 2 for the Northern Division based on the estimates provided by the cost analyst and other managers at LTH. Note: Enter your answers in thousands e.g., 10,000,000 should be…arrow_forward
- BendOR, Inc., manufactures control panels for the electronics industry and has just completed its first year of operations. The following discussion took place between the controller, Gordon Merrick, and the company president, Matt McCray: Matt: I’ve been looking over our first year’s performance by quarters. Our earnings have been increasing each quarter, even though our sales have been flat and our prices and costs have not changed. Why is this? Gordon: Our actual sales have stayed even throughout the year, but we’ve been increasing the utilization of our factory every quarter. By keeping our factory utilization high, we will keep our costs down by allocating the fixed plant costs over a greater number of units. Naturally, this causes our cost per unit to be lower than it would be otherwise. Matt: Yes, but what good is this if we are unable to sell everything that we make? Our inventory is also increasing. Gordon: This is true. However, our unit costs are lower because of the…arrow_forwardSwain Athletic Gear (SAG) operates six retall outlets in a large Midwest city. One is in the center of the city on Cornwall Street and the others are scattered around the perimeter of the city. Management at SAG is concerned about declining sales and profitability of the Cornwall store and believes that outlet has been a drag on profits in recent years. The most recent Income statement for the Cornwall store follows. SWAIN ATHLETIC GEAR Cornwall Street Store Income Statement For the Year Ending February 28 Sales revenue Costs Cost of goods sold Advertising Store administrative salaries Sales commissions Leases and utilities Allocated corporate support Total costs Net loss before tax benefit Tax benefit at 25% Net loss The CFO at SAG has asked for your advice on closing the Cornwall Street store. If the Cornwall Street store is closed, neither total corporate support costs nor operations or costs of the other stores are expected to change. Required: a. Using the worksheet below,…arrow_forwardEthel Company manufactures and sells desk lamps for hotel and motel rooms. Last year, it sold 120,000 units of its model Y lamp for $45 per unit. The company estimates that this volume represents a 24 percent share of the current market. The market is expected to increase by 8 percent next year. Marketing specialists have determined that as a result of new competition, the company's market share will fall to 20 percent (of this larger market). Due to changes in production costs and competitive models, the new price for the lamps will be $48 per unit. The revised volume estimates are based on the $48 price. Required: Estimate Ethel Company's sales revenues from model Y lamps for the coming year.arrow_forward
 Cornerstones of Cost Management (Cornerstones Ser...AccountingISBN:9781305970663Author:Don R. Hansen, Maryanne M. MowenPublisher:Cengage Learning
 Managerial Accounting: The Cornerstone of Busines...AccountingISBN:9781337115773Author:Maryanne M. Mowen, Don R. Hansen, Dan L. HeitgerPublisher:Cengage Learning