Concept explainers
(a)
The characteristic size of the product.
Answer to Problem 4.11P
The characteristic size of the product is
Explanation of Solution
Calculation:
Draw the table to calculate the corresponding
| Sieve Size (inches) |
Percent by weightFiner than Feed |
Linearised |
|
The slope calculated by the slope function in the excel sheet is,
The intercept calculated by the intercept function in the excel sheet is,
Write the expression to calculate the characteristic size.
Here, the characteristic size is
Substitute
Calculate the characteristic size for product.
| Sieve Size (inches) |
Percent by weightFiner than Product |
Linearised |
|
The slope calculated by the slope function in the excel sheet is,
The intercept calculated by intercept function in the excel sheet is,
Calculate the characteristic size for the product.
Substitute
Conclusion:
Thus, the characteristic size of the feed is
The characteristic size of the product is
(b)
If both the distributions fit the Rosin-Rammler particle size distribution function.
Answer to Problem 4.11P
Only the product distribution fits the Rosin-Rammler distribution function.
Explanation of Solution
Only the distribution for the product fits the Rosin-Rammler distribution function as in the feed distribution the characteristic size is of very high order of
Thus, only the product distribution fits the Rosin-Rammler distribution function.
(c)
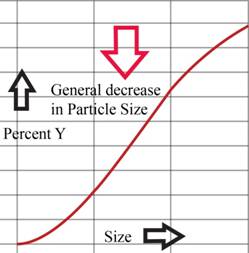
The diagram for the particle size distribution curve for the given cases.
Answer to Problem 4.11P
- The feed becomes wetter (higher moisture content).
The particle size distribution curve is shown below.
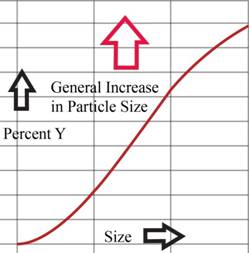
The particle size distribution curve is shown below.
Explanation of Solution
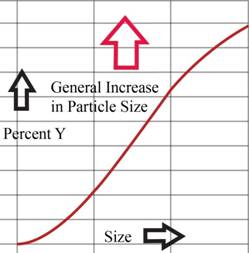
Figure (1)
When the moisture content is increase the product size also increases considerably.
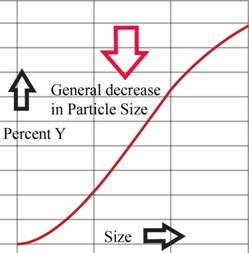
Figure (2)
When the shredder speed is increased the product size decreases considerably.
(d)
The effective power requirement.
Answer to Problem 4.11P
The effective power requirement is
Explanation of Solution
Calculation:
Write the expression to calculate the effective power requirement.
Here, the bond work index is
Substitute
Conclusion:
Thus, the effective power requirement is
Want to see more full solutions like this?
- Q3) The result of sieve analysis of a sample of aggregate given in the Table below. According to ASTM C 33, the sample is acceptable or not? BS Total mass of sample 4 80 g Sieve size 10 mm 5 mm 2.36 mm 1.18 mm 600 μm 300 μm 150 μm €150μm ASTM in 4 8 16 30 50 100 <-100 Mass retained O 80 40 80 110 68 61arrow_forwardDefine the following terms: ( provide the equation and explain what the equationrepresents). a). Saturated Surface-Dry condition of aggregate b). Absorption of aggregates c). Free moisture of aggregates. d). What does a negative free moisture mean and why is it important to consider forconcrete design?arrow_forward7. Make a spread sheet blend template program to perform a blend gradation analysis for up to four stockpiles with the ability to produce automatically semilog or power 0.45 gradation charts. Use the table to demonstrate the template, and calculate the fineness modulus for the aggregate D. Aggregate Blend Percent (%) Sieve size (mm) 37.5 25 19 12.5 9.5 4.75 2.36 1.18 0.60 0.30 0.15 0.075 A 20 100 100 95 89 70 10 2 N|N 2 2 2 2 2 B 25 100 100 100 100 82 55 15 55 32 2 1 с 25 Percent Passing 100 100 100 100 100 100 69 55 35 22 15 6 D 30 100 100 100 100 100 100 86 54 34 25 14 5arrow_forward
- Calculate the sieve analysis shown in Table P5.19 and plot on a semilog gradation paper. What is the maximum size? What is the nominal maximum size?arrow_forwardThree samples of aggregates were taken weighed in moist and dry condition. Moist Dry Unit Unit Absorption Volume Aggregate Wt. Wt. (%) (m³) (kN/m) (kN/m³) Sample 1 23.425 20.018 5.14 0.366 Sample 2 22.7 18.757 3.87 0.695 Sample 3 20.292 18.387 2.62 0.237 Where; Unit weight of water = 9.81 kN/m3 Determine the average free moisture content of the three samples.arrow_forward7. A sample of fine aggregate weighs 544 g when SSD and 530 g when OD. The flask weighs 654 g when filled with water and 985 g when filled with fine aggregate and water. Calculate the bulk specific gravity, apparent specific gravity, and absorption.arrow_forward
- Define the following terms: (don’t just provide the equation, explain what the equationrepresents). a). Saturated Surface-Dry condition of aggregate b). Absorption of aggregates c). Free moisture of aggregates. d). What does a negative free moisture mean and why is it important to consider forconcrete design?arrow_forwardA sieve analysis test was performed on a sample of coarse aggregate and produced the results in Tablea. Calculate the percent passing through each sieve.b. What is the maximum size?c. What is the nominal maximum size?d. Plot the percent passing versus sieve size on a semilog gradation chart.e. Plot the percent passing versus sieve size on a 0.45 gradation chart.f. Referring to Table (ASTM C33), what is the closest size number anddoes it meet the gradation for that standard size?arrow_forward5.17 Calculate the sieve analysis of the following aggregate and plot on a semilog gradation paper. What is the maximum size? What is the nominal maximum size? Sieve Size 25 mm (1 in.) 9.5 mm (3/8 in.) 4.75 mm (No. 4) 2.00 mm (No. 10) 0.425 mm (No. 40) 0.075 mm (No.200) Pan Amount Cumulative Amount Cumulative Percent Retained, g Retained, g 0 47.1 239.4 176.5 92.7 73.5 9.6 Retained Percent Passingarrow_forward
- A sieve analysis test was performed on a sample of aggregate and produced the results shown in Table .Calculate the percent passing through each sieve. Plot the percent passingversus sieve size on:a. a semilog gradation chart, andb. a 0.45 gradation chart (Figure A.25).What is the maximum size? What is the nominal maximum size?arrow_forward2. A sample of fine aggregate weighs 501.2 g when SSD and 491.6 g when OD. The flask weighs 540.6 g when filled with water and 843.1 g when filled with the aggregate sample and water. Calculate the bulk specific gravity, apparent specific gravity and percent absorption.arrow_forwardPlease show your complete solution on a paper with FBDarrow_forward
 Solid Waste EngineeringCivil EngineeringISBN:9781305635203Author:Worrell, William A.Publisher:Cengage Learning,
