
Statistics for Business & Economics, Revised (MindTap Course List)
12th Edition
ISBN: 9781285846323
Author: David R. Anderson, Dennis J. Sweeney, Thomas A. Williams, Jeffrey D. Camm, James J. Cochran
Publisher: South-Western College Pub
expand_more
expand_more
format_list_bulleted
Concept explainers
Videos
Textbook Question
Chapter 15, Problem 52SE
Recall that in exercise 49, the admissions officer for Clearwater College developed the following estimated regression equation relating final college GPA to the student’s SAT mathematics score and high-school GPA.
where
x1 = high-school grad e point average
x2 = SAT mathematics score
y = final college grade point average
A portion of the Minitab computer output follows.
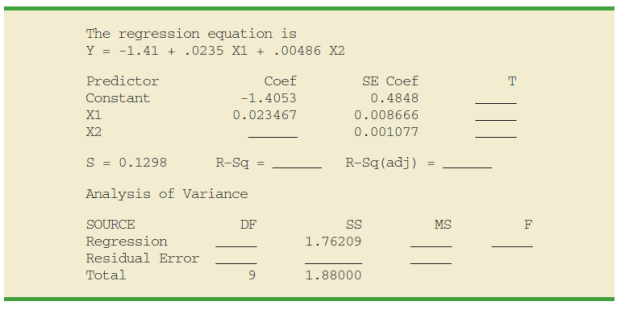
- a. Complete the missing entries in this output.
- b. Use the F test and a .05 level of significance to see whether a significant relationship is present.
- c. Use the t test and α = .05 to test H0: β1 = 0 and H0: β2 = 0.
- d. Did the estimated regression equation provide a good fit to the data? Explain.
Expert Solution & Answer
Want to see the full answer?
Check out a sample textbook solution
Students have asked these similar questions
Find the degrees of freedom in a regression model with an intercept term that has 88 observations and 7 explanatory variables.
Water is being poured into a large cone shape cistern. The volume of water measured and centimeters cubed is reported at different time intervals measured in seconds. A regression analysis was completed and is displayed in the computer output.
what is the equation of the lease squared regression line?
The average number of passing yards per attempt for the New York Jets during the 2011 season was 6.5, and the team’s number of interceptions thrown per attempt was 0.033. Use the estimated regression equation developed in part (c) to predict the percentage of games won by the New York Jets during the 2011 season. (Note: For the 2011 the 2011 season, the New York Jets' record was 7 wins and 9 loses.
Chapter 15 Solutions
Statistics for Business & Economics, Revised (MindTap Course List)
Ch. 15.2 - The estimated regression equation for a model...Ch. 15.2 - Consider the following data for a dependent...Ch. 15.2 - In a regression analysis involving 30...Ch. 15.2 - A shoe store developed the following estimated...Ch. 15.2 - The owner of Showtime Movie Theaters, Inc., would...Ch. 15.2 - The National Football League (NFL) records a...Ch. 15.2 - PC World rated four component characteristics for...Ch. 15.2 - The Cond Nast Traveler Gold List provides ratings...Ch. 15.2 - Waterskiing and wakeboarding are two popular...Ch. 15.2 - Prob. 10E
Ch. 15.3 - In exercise 1, the following estimated regression...Ch. 15.3 - Prob. 12ECh. 15.3 - In exercise 3, the following estimated regression...Ch. 15.3 - In exercise 4, the following estimated regression...Ch. 15.3 - In exercise 5, the owner of Showtime Movie...Ch. 15.3 - In exercise 6, data were given on the average...Ch. 15.3 - Prob. 17ECh. 15.3 - Prob. 18ECh. 15.5 - In exercise 1, the following estimated regression...Ch. 15.5 - Refer to the data presented in exercise 2. The...Ch. 15.5 - The following estimated regression equation was...Ch. 15.5 - In exercise 4, the following estimated regression...Ch. 15.5 - Prob. 23ECh. 15.5 - The Wall Street Journal conducted a study of...Ch. 15.5 - The Cond Nast Traveler Gold List for 2012 provided...Ch. 15.5 - In exercise 10, data showing the values of several...Ch. 15.6 - In exercise 1, the following estimated regression...Ch. 15.6 - Refer to the data in exercise 2. The estimated...Ch. 15.6 - In exercise 5, the owner of Showtime Movie...Ch. 15.6 - Prob. 30ECh. 15.6 - The American Association of Individual Investors...Ch. 15.7 - Consider a regression study involving a dependent...Ch. 15.7 - Consider a regression study involving a dependent...Ch. 15.7 - Management proposed the following regression model...Ch. 15.7 - Refer to the Johnson Filtration problem introduced...Ch. 15.7 - This problem is an extension of the situation...Ch. 15.7 - The Consumer Reports Restaurant Customer...Ch. 15.7 - A 10-year study conducted by the American Heart...Ch. 15.8 - Data for two variables, x and y, follow. xi 1 2 3...Ch. 15.8 - Data for two variables, x and y, follow. xi 22 24...Ch. 15.8 - Exercise 5 gave the following data on weekly gross...Ch. 15.8 - The following data show the curb weight,...Ch. 15.8 - Prob. 43ECh. 15.9 - Refer to the Simmons Stores example introduced in...Ch. 15.9 - In Table 15.12 we provided estimates of the...Ch. 15.9 - Community Bank would like to increase the number...Ch. 15.9 - Over the past few years the percentage of students...Ch. 15.9 - The Tire Rack maintains an independent consumer...Ch. 15 - The admissions officer for Clearwater College...Ch. 15 - The personnel director for Electronics Associates...Ch. 15 - A partial computer output from a regression...Ch. 15 - Recall that in exercise 49, the admissions officer...Ch. 15 - Recall that in exercise 50 the personnel director...Ch. 15 - The Tire Rack, Americas leading online distributor...Ch. 15 - The Department of Energy and the U.S....Ch. 15 - A portion of a data set containing information for...Ch. 15 - Fortune magazine publishes an annual list of the...Ch. 15 - Consumer Research, Inc., is an independent agency...Ch. 15 - Matt Kenseth won the 2012 Daytona 500, the most...Ch. 15 - Finding the Best Car Value When trying to decide...
Knowledge Booster


Learn more about
Need a deep-dive on the concept behind this application? Look no further. Learn more about this topic, statistics and related others by exploring similar questions and additional content below.Similar questions
- Find the equation of the regression line for the following data set. x 1 2 3 y 0 3 4arrow_forwardDoes Table 2 represent a linear function? If so, finda linear equation that models the data.arrow_forwardIf your graphing calculator is capable of computing a least-squares sinusoidal regression model, use it to find a second model for the data. Graph this new equation along with your first model. How do they compare?arrow_forward
- What is regression analysis? Describe the process of performing regression analysis on a graphing utility.arrow_forwardcreate graph of the two-variable data with a regression line, r, r2, and separate residual plotarrow_forwardListed below are systolic blood pressure measurements (in mm Hg) obtained from the same woman. Find the regression equation, letting the right arm blood pressure be the predictor (x) variable. Find the best predicted systolic blood pressure in the left arm given that the systolic blood pressure in the right arm is 85 mm Hg. Use a significance level of 0.05. Right Arm 100 99 91 76 Left Arm 175 170 146 147 Click the icon to view the critical values of the Pearson correlation coefficient r The regression equation is y=+x. (Round to one decimal place as needed.) % 5 Given that the systolic blood pressure in the right arm is 85 mm Hg, the best predicted systolic blood pressure in the left arm is mm Hg. (Round to one decimal place as needed.) Submit test Copyright © 2022 Pearson Education Inc. All rights reserved. Terms of Use | Privacy Policy Permissions Contact Us 6: 6 G H 8 4- 7 B N a hp 8 76 146 JK M H N (?) 83°F 12 + [ insert see score past due see score 40) 10:26 PM 8/9/2022 prt sc…arrow_forward
- A FIFA World Cup football is dropped from 35 different heights (in cm) and the height of the bounce is recorded (in cm.) The regression analysis gives the model bounce = -0.1 +0.70 drop. Predict the height of the bounce if dropped from 64 cm. 44.7 cm 44.8 cm 64.6 cm 91.57 cm 44.9 cmarrow_forwardA magazine publishes restaurant ratings for various locations around the world. The magazine rates the restaurants for food, decor, service, and the cost per person. Develop a regression model to predict the cost per person, based on a variable that represents the sum of the three ratings. The magazine has compiled the accompanying table of this summated ratings variable and the cost per person for 25 restaurants in a major city. Complete parts (a) through (e) below. Click the icon to view the table of summated ratings and cost per person. a. Construct a scatter plot. Choose the correct graph below. O A. Ов. OC. OD. ACost ($) 90- Q A Cost ($) 904 A Cost ($) 90- ACost ($) 90- 0- 0- 0- 0- 90 Rating 90 Rating 90 90 Rating Rating Summated ratings and cost per person b. Assuming a linear relationship, use the least-squares method to compute the regression coefficients bo and b,. bo =D and b, =O (Round to two decimal places as needed.) Summated Rating Cost ($ per person)|9 c. Interpret the…arrow_forwardA magazine publishes restaurant ratings for various locations around the world. The magazine rates the restaurants for food, decor, service, and the cost per person. Develop a regression model to predict the cost per person, based on a variable that represents the sum of the three ratings. The magazine has compiled the accompanying table of this summated ratings variable and the cost per person for 25 restaurants in a major city. Complete parts (a) through (e) below. Click the icon to view the table of summated ratings and cost per person. ..... a. Construct a scatter plot. Choose the correct graph below. A. Ов. С. D. ACost ($) 90- ACost ($) 90- ACost ($) 90- ACost ($) 90- 0- 0- 90 90 90 90 Rating Rating Rating Rating b. Assuming a linear relationship, use the least-squares method to compute the regression coefficients b, and b,. bo = and b, (Round to two decimal places as needed.) c. Interpret the meaning of the Y-intercept, bo, and the slope, b,. Choose the correct answer below. O A.…arrow_forward
arrow_back_ios
arrow_forward_ios
Recommended textbooks for you

 Glencoe Algebra 1, Student Edition, 9780079039897...AlgebraISBN:9780079039897Author:CarterPublisher:McGraw Hill
 Algebra & Trigonometry with Analytic GeometryAlgebraISBN:9781133382119Author:SwokowskiPublisher:Cengage
 Algebra and Trigonometry (MindTap Course List)AlgebraISBN:9781305071742Author:James Stewart, Lothar Redlin, Saleem WatsonPublisher:Cengage Learning
 Trigonometry (MindTap Course List)TrigonometryISBN:9781305652224Author:Charles P. McKeague, Mark D. TurnerPublisher:Cengage Learning
Glencoe Algebra 1, Student Edition, 9780079039897...
Algebra
ISBN:9780079039897
Author:Carter
Publisher:McGraw Hill
Algebra & Trigonometry with Analytic Geometry
Algebra
ISBN:9781133382119
Author:Swokowski
Publisher:Cengage
Algebra and Trigonometry (MindTap Course List)
Algebra
ISBN:9781305071742
Author:James Stewart, Lothar Redlin, Saleem Watson
Publisher:Cengage Learning
Trigonometry (MindTap Course List)
Trigonometry
ISBN:9781305652224
Author:Charles P. McKeague, Mark D. Turner
Publisher:Cengage Learning
Correlation Vs Regression: Difference Between them with definition & Comparison Chart; Author: Key Differences;https://www.youtube.com/watch?v=Ou2QGSJVd0U;License: Standard YouTube License, CC-BY
Correlation and Regression: Concepts with Illustrative examples; Author: LEARN & APPLY : Lean and Six Sigma;https://www.youtube.com/watch?v=xTpHD5WLuoA;License: Standard YouTube License, CC-BY