
Concept explainers
Videos
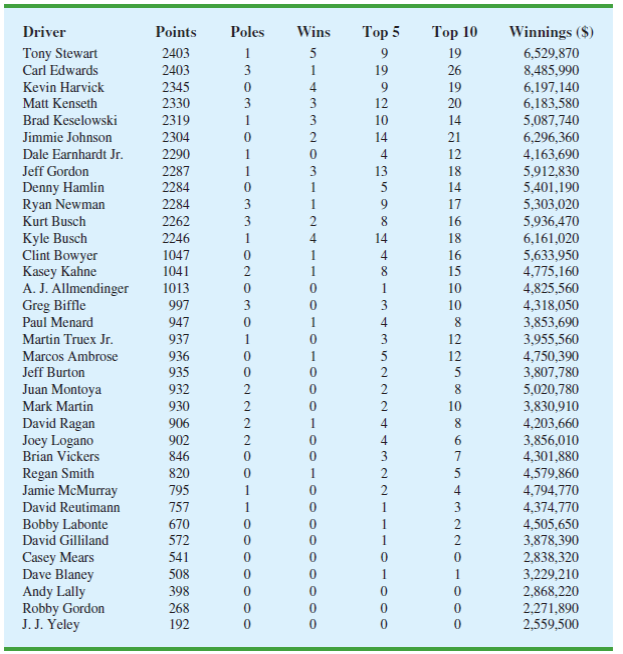
Matt Kenseth won the 2012 Daytona 500, the most important race of the NASCAR season. His win was no surprise because for the 2011 season he finished fourth in the point standings with 2330 points, behind Tony Stewart (2403 points), Carl Edwards (2403 points), and Kevin Harvick (2345 points). In 2011 he earned $6,183,580 by winning three Poles (fastest driver in qualifying), winning three races, finishing in the top five 12 times, and finishing in the top ten 20 times. NASCAR’s point system in 2011 allocated 43 points to the driver who finished first, 42 points to the driver who finished second, and so on down to 1 point for the driver who finished in the 43rd position. In addition any driver who led a lap received 1 bonus point, the driver who led the most laps received an additional bonus point, and the race winner was awarded 3 bonus points. But, the maximum number of points a driver could earn in any race was 48. Table 15.13 shows data for the 2011 season for the top 35 drivers (NASCAR website, February 28, 2011).
TABLE 15.13 NASCAR RESULTS FOR THE 2011 SEASON
Managerial Report
- 1. Suppose you wanted to predict Winnings ($) using only the number of poles won (Poles), the number of wins (Wins), the number of top five finishes (Top 5), or the number of top ten finishes (Top 10). Which of these four variables provides the best single predictor of winnings?
- 2. Develop an estimated regression equation that can be used to predict Winnings ($) given the number of poles won (Poles), the number of wins (Wins), the number of top five finishes (Top 5), and the number of top ten (Top 10) finishes. Test for individual significance and discuss your findings and conclusions.
- 3. Create two new independent variables: Top 2-5 and Top 6-10. Top 2-5 represents the number of times the driver finished between second and fifth place and Top 6-10 represents the number of times the driver finished between sixth and tenth place. Develop an estimated regression equation that can be used to predict Winnings ($) using Poles, Wins, Top 2-5, and Top 6-10. Test for individual significance and discuss your findings and conclusions.
- 4. Based upon the results of your analysis, what estimated regression equation would you recommend using to predict Winnings ($)? Provide an interpretation of the estimated regression coefficients for this equation.

Trending nowThis is a popular solution!

Chapter 15 Solutions
Statistics for Business & Economics, Revised (MindTap Course List)


- The median annual income for someone who has an Associates Degree is $31,936. The median annual income for someone with a high school degree is $26,123. Based on the median income, how much more would someone with an associate's degree earn than someone with a high school degree over 40 years?arrow_forwarda service station attendant is paid time and a half for working over 40 hours. Last week he worked 47 hours and earned $580.75. What is his regular hourly wage?arrow_forward-3.7 = 5.4x - 5.5arrow_forward
- During a spring clearance sale, Sears advertise 1/4 off the list of Model II microwave ovens and an additional 1/5 off the sale price for ovens that are scratched or dented. If the list price of a Model II is $240, what is the sale price?arrow_forwardA service station attendant is paid time-and-a-half for working over 40 hours per week. Last week the attendant worked 49 h and earned $668.75. Find the attendant's regular hourly wage.arrow_forwardWhen filing 2015 federal income taxes as a single filer, you paid 10% on the first $9,225 earned, and 15% on moneys earned between $9,226–$37,450. If a person filing their taxes as a single filer earned a total of $36,500 in 2015arrow_forward
- The median annual income for workers aged 25 or older in the United States in 2014 was $48372 for an associate’s degree and $52655 for a bachelor’s degree. The annual income for adults with a bachelor’s degree is what percent greater than for adults with an associate’s degree?arrow_forwardThe percentage of buyers who paid more than $22,000 isarrow_forwardA business with 150 workers pays 113 employees P45.50 per hour and 37 employees P51.25 per hour. Calculate the average hourly wage.arrow_forward
- Four students drove from New York to Florida (1200 miles) at a speed of 40 mi/hr. Because they needed to make it to statistics class on time, they returned at a speed of 60 mi/hr. What is their average speed for the round triparrow_forwardAn item has a new selling price of P200.00 and markdown of P30.00. Find its original selling price and markdown rate based on original selling price.arrow_forwardThe average amount of money held by each child in a group of 5 is $0.50.If one of the children loses a quarter , what is the new average of money held by each child ?arrow_forward
 Algebra: Structure And Method, Book 1AlgebraISBN:9780395977224Author:Richard G. Brown, Mary P. Dolciani, Robert H. Sorgenfrey, William L. ColePublisher:McDougal Littell
 Algebra for College StudentsAlgebraISBN:9781285195780Author:Jerome E. Kaufmann, Karen L. SchwittersPublisher:Cengage Learning
 Intermediate AlgebraAlgebraISBN:9781285195728Author:Jerome E. Kaufmann, Karen L. SchwittersPublisher:Cengage Learning