
Essentials Of Statistics For Business & Economics
9th Edition
ISBN: 9780357045435
Author: David R. Anderson, Dennis J. Sweeney, Thomas A. Williams, Jeffrey D. Camm, James J. Cochran
Publisher: South-Western College Pub
expand_more
expand_more
format_list_bulleted
Concept explainers
Videos
Textbook Question
Chapter 14.8, Problem 47E
Restaurant Advertising and Revenue. Data on advertising expenditures and revenue (in thousands of dollars) for the Four Seasons Restaurant follow.
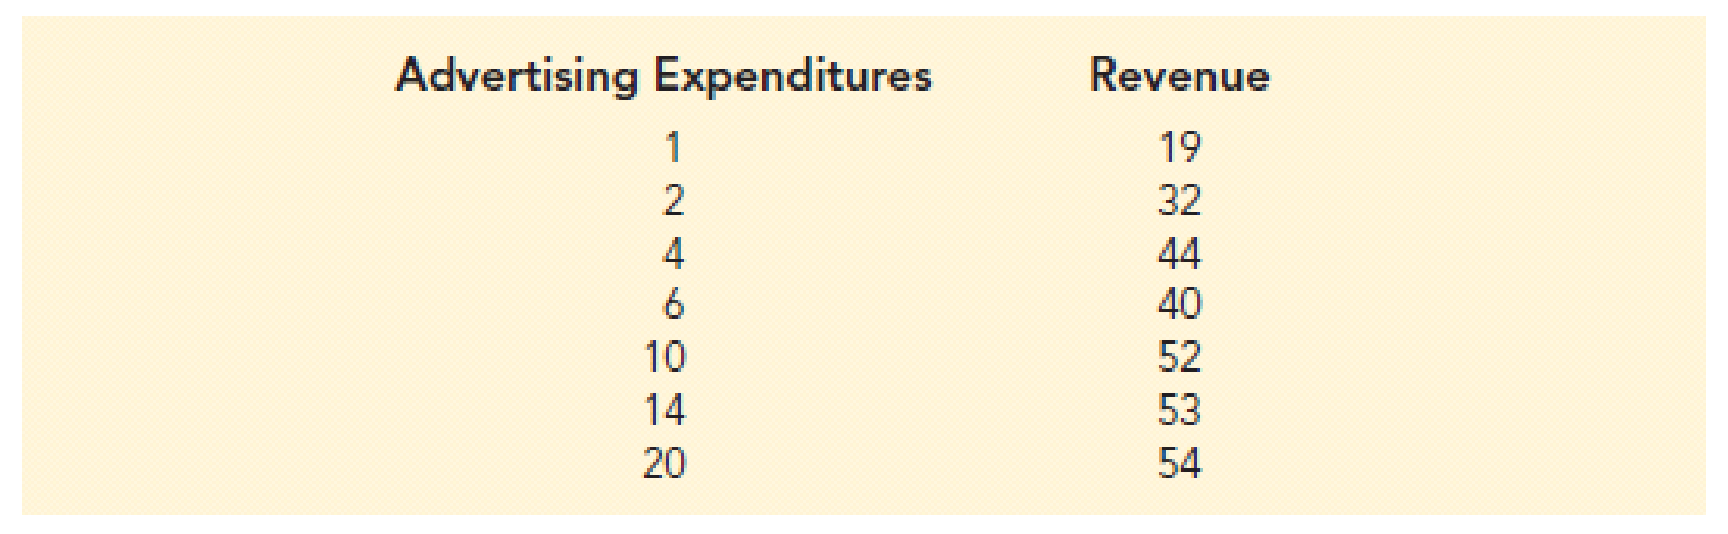
- a. Let x equal advertising expenditures and y equal revenue. Use the method of least squares to develop a straight line approximation of the relationship between the two variables.
- b. Test whether revenue and advertising expenditures are related at a .05 level of significance.
- c. Prepare a residual plot of y −
- d. What conclusions can you draw from residual analysis? Should this model be used, or should we look for a better one?
Expert Solution & Answer
Want to see the full answer?
Check out a sample textbook solution
Students have asked these similar questions
The accompanying data represent the weights of various domestic cars and their gas mileages in the city. The linear correlation coefficient between the weight of a car and its miles per gallon in the city is r= - 0.972. The least-squares regression line treating
weight as the explanatory variable and miles per gallon as the response variable is y= - 0.0070x + 44.4405. Complete parts (a) and (b) below.
Click the icon to view the data table.
.....
(a) What proportion of the variability in miles per gallon is explained by the relation between weight of the car and miles per gallon?
The proportion of the variability in miles per gallon explained by the relation between weight of the car and miles per gallon is
%.
(Round to one decimal place as needed.)
(b) Interpret the coefficient of determination.
% of the variance in
is
by the linear model.
Data Table
(Round to one decimal p
Full data set
gas mileage
Miles per
Weight
(pounds), x
Weight
(pounds), x
Miles per
Gallon, y
Car
Car
Gallon, y…
create graph of the two-variable data with a regression line, r, r2, and separate residual plot
The accompanying data represent the weights of various domestic cars and their gas mileages in the city. The linear correlation coefficient between the weight of a car and its miles per gallon in the city is r= - 0.984. The least-squares regression
line treating weight as the explanatory variable and miles per gallon as the response variable is y = - 0.0066x + 43.3954. Complete parts (a) and (b) below.
Click the icon to view the data table.
(a) What proportion of the variability in miles per gallon is explained by the relation between weight of the car and miles per gallon?
Data Table
The proportion of the variability in miles per gallon explained by the relation between weight of the car and miles per gallon is %.
(Round to one decimal place as needed.)
(b) Interpret the coefficient of determination.
Full data set
% of the variance in
is
by the linear model.
Miles per
Miles per
Weight
(pounds), x
Weight
(pounds), x
Car
Car
(Round to one decimal place as needed.)
Gallon, y
Gallon, y…
Chapter 14 Solutions
Essentials Of Statistics For Business & Economics
Ch. 14.2 - Given are five observations for two variables, x...Ch. 14.2 - Given are five observations for two variables, x...Ch. 14.2 - Given are five observations collected in a...Ch. 14.2 - Retail and Trade: Female Managers. The following...Ch. 14.2 - Production Line Speed and Quality Control. Brawdy...Ch. 14.2 - The National Football League (NFL) records a...Ch. 14.2 - Sales Experience and Performance. A sales manager...Ch. 14.2 - Broker Satisfaction. The American Association of...Ch. 14.2 - Estimating Landscaping Expenditures. David’s...Ch. 14.2 - Age and the Price of Wine. For a particular red...
Ch. 14.2 - Laptop Ratings. To help consumers in purchasing a...Ch. 14.2 - Stock Beta. In June of 2016, Yahoo Finance...Ch. 14.2 - Auditing Itemized Tax Deductions. To the Internal...Ch. 14.2 - Distance and Absenteeism. A large city hospital...Ch. 14.3 - 15. The data from exercise 1...Ch. 14.3 - Prob. 16ECh. 14.3 - The data from exercise 3 follow.
The estimated...Ch. 14.3 - Price and Quality of Headphones. The following...Ch. 14.3 - Prob. 19ECh. 14.3 - Price and Weight of Bicycles. Bicycling, the...Ch. 14.3 - Cost Estimation. An important application of...Ch. 14.3 - Prob. 22ECh. 14.5 - The data from exercise 1 follow.
Compute the mean...Ch. 14.5 - The data from exercise 2 follow.
Compute the mean...Ch. 14.5 - The data from exercise 3 follow.
What is the...Ch. 14.5 - Headphones Conclusion. In exercise 18, the data on...Ch. 14.5 - College CPA and Salary. Do students with higher...Ch. 14.5 - Broker Satisfaction Conclusion. In exercise 8,...Ch. 14.5 - Cost Estimation Conclusion. Refer to exercise 21,...Ch. 14.5 - Significance of Fleet Size on Rental Car Revenue....Ch. 14.5 - Significance of Racing Bike Weight on Price. In...Ch. 14.6 - The data from exercise 1 follow. xi 1 2 3 4 5 yi 3...Ch. 14.6 - Prob. 33ECh. 14.6 - 34. The data from exercise 3...Ch. 14.6 - Restaurant Lines. Many small restaurants in...Ch. 14.6 - 36. In exercise 7, the data on y = annual sales ($...Ch. 14.6 - In exercise 13, data were given on the adjusted...Ch. 14.6 - Prob. 38ECh. 14.6 - Entertainment Spend. The Wall Street Journal asked...Ch. 14.7 - Apartment Selling Price. The commercial division...Ch. 14.7 - Computer Maintenance. Following is a portion of...Ch. 14.7 - Annual Sales and Salesforce. A regression model...Ch. 14.7 - Estimating Setup Time. Sherry is a production...Ch. 14.7 - Auto Racing Helmet. Automobile racing,...Ch. 14.8 - Given are data for two variables, x and y. a....Ch. 14.8 - Prob. 46ECh. 14.8 - Restaurant Advertising and Revenue. Data on...Ch. 14.8 - Experience and Sales. Refer to exercise 7, where...Ch. 14.8 - Buy Versus Rent. Occasionally, it has been the...Ch. 14.9 - Consider the following data for two variables, x...Ch. 14.9 - Consider the following data for two variables, x...Ch. 14.9 - Predicting Charity Expenses. Charity Navigator is...Ch. 14.9 - Supermarket Checkout Lines. Retail chain Kroger...Ch. 14.9 - Valuation of a Major League Baseball Team. The...Ch. 14 - 55. Does a high value of r2 imply that two...Ch. 14 - Prob. 56SECh. 14 - What is the purpose of testing whether 1 = 0? If...Ch. 14 - Stock Market Performance. The Dow Jones Industrial...Ch. 14 - Home Sire and Price. Is the number of square feet...Ch. 14 - Online Education. One of the biggest changes in...Ch. 14 - Machine Maintenance. Jensen Tire & Auto is in the...Ch. 14 - Production Rate and Quality Control. In a...Ch. 14 - Absenteeism and Location. A sociologist was hired...Ch. 14 - Bus Maintenance. The regional transit authority...Ch. 14 - Studying and Grades. A marketing professor at...Ch. 14 - Market Beta. Market betas for individual stocks...Ch. 14 - Income and Percent Audited. The Transactional...Ch. 14 - Used Car Mileage and Price. The Toyota Camry is...Ch. 14 - One measure of the risk or volatility of an...Ch. 14 - As part of a study on transportation safety, the...Ch. 14 - Consumer Reports tested 166 different...Ch. 14 - When trying to decide what car to buy, real value...Ch. 14 - Buckeye Creek Amusement Park is open from the...
Knowledge Booster


Learn more about
Need a deep-dive on the concept behind this application? Look no further. Learn more about this topic, statistics and related others by exploring similar questions and additional content below.Similar questions
- YOUR TURN 1 Calculate the least squares line for the following data. x 1 2 3 4 5 6 y 3 4 6 5 7 8arrow_forwardRespiratory Rate Researchers have found that the 95 th percentile the value at which 95% of the data are at or below for respiratory rates in breath per minute during the first 3 years of infancy are given by y=101.82411-0.0125995x+0.00013401x2 for awake infants and y=101.72858-0.0139928x+0.00017646x2 for sleeping infants, where x is the age in months. Source: Pediatrics. a. What is the domain for each function? b. For each respiratory rate, is the rate decreasing or increasing over the first 3 years of life? Hint: Is the graph of the quadratic in the exponent opening upward or downward? Where is the vertex? c. Verify your answer to part b using a graphing calculator. d. For a 1- year-old infant in the 95 th percentile, how much higher is the walking respiratory rate then the sleeping respiratory rate? e. f.arrow_forwardThe following table provides values of the function f(x,y). However, because of potential; errors in measurement, the functional values may be slightly inaccurately. Using the statistical package included with a graphical calculator or spreadsheet and critical thinking skills, find the function f(x,y)=a+bx+cy that best estimate the table where a, b and c are integers. Hint: Do a linear regression on each column with the value of y fixed and then use these four regression equations to determine the coefficient c. x y 0 1 2 3 0 4.02 7.04 9.98 13.00 1 6.01 9.06 11.98 14.96 2 7.99 10.95 14.02 17.09 3 9.99 13.01 16.01 19.02arrow_forward
- Find the equation of the regression line for the following data set. x 1 2 3 y 0 3 4arrow_forwardFind the equation for the least squares regression line of the data described below. Meteorologists in a seaside town wanted to understand how their annual rainfall is affected by the temperature of coastal waters. For the past few years, they monitored the average temperature of coastal waters (in Celsius), x, as well as the annual rainfall (in millimetres), y. Rainfall statistics • The mean of the x-values is 11.503. • The mean of the y-values is 366.637. • The sample standard deviation of the x-values is 4.900. • The sample standard deviation of the y-values is 44.387. • The correlation coefficient of the data set is 0.896. Round your answers to the nearest thousandth. y = L Submitarrow_forwardhe scatter plot below shows the average cost of a designer jacket in a sample of years between 2000 and 2015. The least squares regression line modeling this data is given by yˆ=−4815+3.765x. A scatterplot has a horizontal axis labeled Year from 2005 to 2015 in increments of 5 and a vertical axis labeled Price ($) from 2660 to 2780 in increments of 20. The following points are plotted: (2003, 2736); (2004, 2715); (2007, 2675); (2009, 2719); (2013, 270). All coordinates are approximate. Interpret the y-intercept of the least squares regression line. Is it feasible? Select the correct answer below: The y-intercept is −4815, which is not feasible because a product cannot have a negative cost. The y-intercept is 3.765, which is not feasible because an expensive product such as a designer jacket cannot have such a low cost. The y-intercept is −4815, which is feasible because it is the value from the regression equation. The y-intercept is…arrow_forward
arrow_back_ios
arrow_forward_ios
Recommended textbooks for you

 Algebra & Trigonometry with Analytic GeometryAlgebraISBN:9781133382119Author:SwokowskiPublisher:Cengage
 Calculus For The Life SciencesCalculusISBN:9780321964038Author:GREENWELL, Raymond N., RITCHEY, Nathan P., Lial, Margaret L.Publisher:Pearson Addison Wesley,
 Glencoe Algebra 1, Student Edition, 9780079039897...AlgebraISBN:9780079039897Author:CarterPublisher:McGraw Hill
 Trigonometry (MindTap Course List)TrigonometryISBN:9781305652224Author:Charles P. McKeague, Mark D. TurnerPublisher:Cengage Learning
 Big Ideas Math A Bridge To Success Algebra 1: Stu...AlgebraISBN:9781680331141Author:HOUGHTON MIFFLIN HARCOURTPublisher:Houghton Mifflin Harcourt
Algebra & Trigonometry with Analytic Geometry
Algebra
ISBN:9781133382119
Author:Swokowski
Publisher:Cengage
Calculus For The Life Sciences
Calculus
ISBN:9780321964038
Author:GREENWELL, Raymond N., RITCHEY, Nathan P., Lial, Margaret L.
Publisher:Pearson Addison Wesley,
Glencoe Algebra 1, Student Edition, 9780079039897...
Algebra
ISBN:9780079039897
Author:Carter
Publisher:McGraw Hill
Trigonometry (MindTap Course List)
Trigonometry
ISBN:9781305652224
Author:Charles P. McKeague, Mark D. Turner
Publisher:Cengage Learning
Big Ideas Math A Bridge To Success Algebra 1: Stu...
Algebra
ISBN:9781680331141
Author:HOUGHTON MIFFLIN HARCOURT
Publisher:Houghton Mifflin Harcourt
Correlation Vs Regression: Difference Between them with definition & Comparison Chart; Author: Key Differences;https://www.youtube.com/watch?v=Ou2QGSJVd0U;License: Standard YouTube License, CC-BY
Correlation and Regression: Concepts with Illustrative examples; Author: LEARN & APPLY : Lean and Six Sigma;https://www.youtube.com/watch?v=xTpHD5WLuoA;License: Standard YouTube License, CC-BY