
(a)
To explain:
Thestandard viewing window and then select from the menu.
(a)
Explanation of Solution
Given:
Concept used:
Replace the inequality sign and sketch the graph of the resulting equation (use a dashed line for < or > and a solid line for
Test one point in each of the region formed by the graph
If the point satisfies the inequality then shade the entire region to denote that every point in the region satisfies the inequality
Calculation:
Test one point in each of the region formed by the graph
If the point satisfies the inequality then shade the entire region to denote that every point in the region satisfies the inequality
Draw the table
Draw the graph
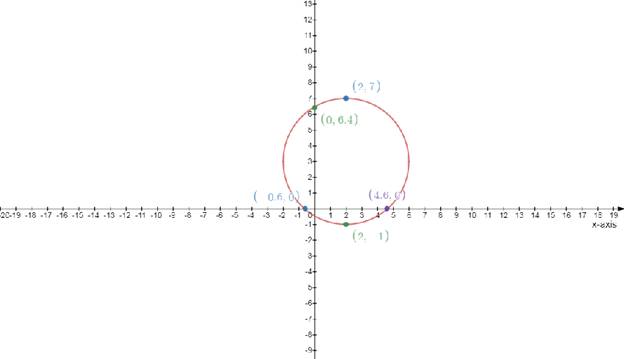 Standard window
Draw Menu:
Circle
(b)
To describe:The viewing on the screen.
(b)
Explanation of Solution
Given:
Concept used:
Replace the inequality sign and sketch the graph of the resulting equation (use a dashed line for < or > and a solid line for
Test one point in each of the region formed by the graph
If the point satisfies the inequality then shade the entire region to denote that every point in the region satisfies the inequality
Calculation:
Test one point in each of the region formed by the graph
If the point satisfies the inequality then shade the entire region to denote that every point in the region satisfies the inequality
Draw the table
Draw the graph
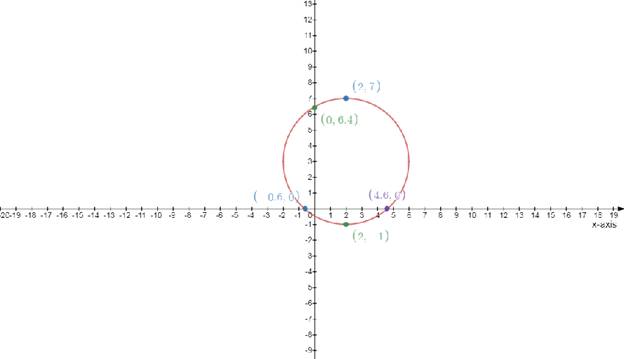 A circle centered at
Radius
(c)
To describe:The equation of the graph.
(c)
Explanation of Solution
Given:
Concept used:
Replace the inequality sign and sketch the graph of the resulting equation (use a dashed line for < or > and a solid line for
Test one point in each of the region formed by the graph
If the point satisfies the inequality then shade the entire region to denote that every point in the region satisfies the inequality
Calculation:
Test one point in each of the region formed by the graph
If the point satisfies the inequality then shade the entire region to denote that every point in the region satisfies the inequality
Draw the table
Draw the graph

(d)
To draw:
The graph and the equation.
(d)
Explanation of Solution
Given:
Concept used:
Replace the inequality sign and sketch the graph of the resulting equation (use a dashed line for < or > and a solid line for
Test one point in each of the region formed by the graph
If the point satisfies the inequality then shade the entire region to denote that every point in the region satisfies the inequality
Calculation:
Test one point in each of the region formed by the graph
If the point satisfies the inequality then shade the entire region to denote that every point in the region satisfies the inequality
Draw the table
Draw the graph
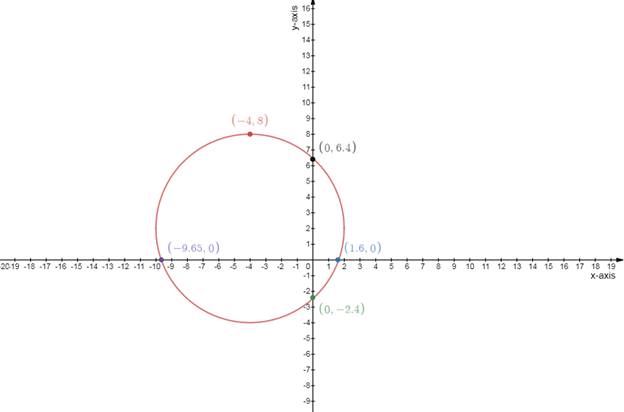 Standard window
Draw Menu:
Circle
Chapter 10 Solutions
Advanced Mathematical Concepts: Precalculus with Applications, Student Edition
Additional Math Textbook Solutions
Thomas' Calculus: Early Transcendentals (14th Edition)
Calculus: Early Transcendentals (3rd Edition)
Single Variable Calculus: Early Transcendentals (2nd Edition) - Standalone book
University Calculus: Early Transcendentals (4th Edition)
Calculus: Early Transcendentals (2nd Edition)

 Calculus: Early TranscendentalsCalculusISBN:9781285741550Author:James StewartPublisher:Cengage Learning
 Thomas' Calculus (14th Edition)CalculusISBN:9780134438986Author:Joel R. Hass, Christopher E. Heil, Maurice D. WeirPublisher:PEARSON
 Calculus: Early Transcendentals (3rd Edition)CalculusISBN:9780134763644Author:William L. Briggs, Lyle Cochran, Bernard Gillett, Eric SchulzPublisher:PEARSON
 Calculus: Early TranscendentalsCalculusISBN:9781319050740Author:Jon Rogawski, Colin Adams, Robert FranzosaPublisher:W. H. Freeman
 Calculus: Early Transcendental FunctionsCalculusISBN:9781337552516Author:Ron Larson, Bruce H. EdwardsPublisher:Cengage Learning