Thinking Like an Engineer: An Active Learning Approach (3rd Edition)
3rd Edition
ISBN: 9780133593211
Author: Elizabeth A. Stephan, David R. Bowman, William J. Park, Benjamin L. Sill, Matthew W. Ohland
Publisher: PEARSON
expand_more
expand_more
format_list_bulleted
Concept explainers
Videos
Textbook Question
Chapter 10, Problem 5RQ
- 4.
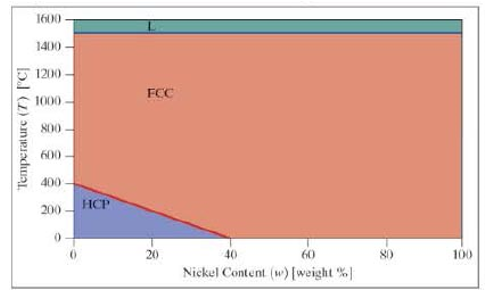 A simplified phase diagram for cobalt and nickel is shown. Assuming the lines shown are linear, we can say the mixture has the following characteristics:
 - ■ Above 1500°C, it is a liquid.
- ■ Below 1500°C, there are two possible phases: face-centered cubic (FCC) phase and hexagonal close-packed (HCP) phase.
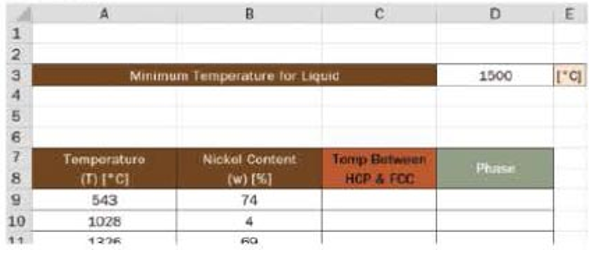 Use the workbook provided to determine the phase of a mixture, given the temperature and nickel content.
- a. Write the mathematical equation to describe the dividing line between the HCP region and the FCC region in column C. Reference the nickel content found in column B as needed. Add any absolute reference cells you feel are needed to complete this calculation.
- b. Write the conditional statement to determine the phase in column D. For simplicity, call the phases HCP, FCC, and L. For points on the line, YOU can decide which phase they are included in.
- c. Use conditional formatting to indicate each phase. Provide a color key.
Expert Solution & Answer
Want to see the full answer?
Check out a sample textbook solution
Students have asked these similar questions
help pls
A two-phase phase diagram is shown. Answer the following
questions
t
-1300
1500+
Temperature
1100
0
34
54! 166 482
80
Composition of Ni %
20
What is the composition (in % Cu) of the solid phase
corresponding to the red dot in between the solidus and liquidus
lines in the phase diagram? Just write the number. Do not write
the % symbol.
Question 17
2.33
100
An alloy is being made with 66% Ni and 34% Cu. When it is cooled
from 1500°C to the temperature corresponding to the red dot in
the phase diagram, how many kg of liquid is present in the
mixture?
100
atm
1 atm
0.118
atm
114 °C 184 °C
535 °C
Temperature (not to scale)
a.) Use the above generic phase diagram, clearly identify where you would find the
following:
Gas, Liquid, Solid, Triple Point, Draw arrows and label to indicate the six
transitions (melting, freezing, sublimation, deposition, vaporization and
condensation)
b.) Based on the above phase diagram, what phase would you be in at a pressure of
50 atm and 300°C?
c.) Based on the above phase diagram at what temperature in °C would vaporization
occur under normal conditions?
d.) If the pressure was 0.050 atm and 425°C, what phase would you be in?
e.) If the pressure was 0.118 atm and temperature was 114°C, what phase(s) would
you be in?
f.) At approximately what temperature would the normal freezing point be in °C?
g.) If the pressure was 0.105 atm and starting at a temperature of 32°C to 450°C what
phase changes would occur (put in increasing temperature order).
Pressure (not to scale)
Use the data to plot the phase on the phase diagram for each row
Chapter 10 Solutions
Thinking Like an Engineer: An Active Learning Approach (3rd Edition)
Ch. 10.1 - Type "5" in cell E22 and "9" in cell E23; type...Ch. 10.1 - Type “20” into cell G22 and “=$G$22 + 10” in cell...Ch. 10.1 - Prob. 3CCCh. 10.1 - Type “=$A28 + 5” in cell G28. Copy cell G28 down...Ch. 10.2 - Launch a new worksheet. Type the following Excel...Ch. 10.2 - As part of the design of a high-performance...Ch. 10.3 - Evaluate the following expressions. What is the...Ch. 10.3 - Continue the example in CC 10-6 above. The...Ch. 10.4 - This is a continuation of the worksheet you...Ch. 10.5 - Prob. 11CC
Ch. 10.6 - In 1980, the Environmental Protection Agency (EPA)...Ch. 10 - ICA 10-5 The worksheet shown here was designed to...Ch. 10 - The worksheet provided was designed to calculate...Ch. 10 - Some alternate energy technologies, such as wind...Ch. 10 - The worksheet shown was designed to calculate the...Ch. 10 - The worksheet shown was designed to calculate the...Ch. 10 - Refer to the following worksheet. The following...Ch. 10 - Write the output value that would appear in a cell...Ch. 10 - Write the output value that would appear in a cell...Ch. 10 - Refer to the following worksheet. In all...Ch. 10 - Prob. 10ICACh. 10 - A bioengineer conducts clinical trials on...Ch. 10 - Refer to the Worksheet shown, set up to calculate...Ch. 10 - You are interested in analyzing different implant...Ch. 10 - You have a large stock of several values of...Ch. 10 - We accidentally drop a tomato from the balcony of...Ch. 10 - You are interested in calculating the best place...Ch. 10 - 1. A history major of your acquaintance is...Ch. 10 - Prob. 3RQCh. 10 - 4. A phase diagram for carbon and platinum is...Ch. 10 - 4. A simplified phase diagram for cobalt and...Ch. 10 - 5. You enjoy drinking coffee but are particular...Ch. 10 - 6. In the 1950s, a team at Los Alamos National...Ch. 10 - Use the following phase diagram for questions 7...Ch. 10 - Use the following phase diagram for questions 7...Ch. 10 - Use the following phase diagram for questions 9...Ch. 10 - Use the following phase diagram for questions 9...Ch. 10 - 11. When liquid and vapor coexist in a container...Ch. 10 - 12. The ideal gas law assumes that molecules...Ch. 10 - One of the NAE Grand Challenges for Engineering is...Ch. 10 - 16. A substance used to remove the few remaining...Ch. 10 - 15 Create an Excel worksheet that will allow the...Ch. 10 - Prob. 18RQ
Additional Engineering Textbook Solutions
Find more solutions based on key concepts
What types of polymers are most commonly blow molded?
Degarmo's Materials And Processes In Manufacturing
What is the importance of modeling in engineering? How are the mathematical models for engineering processes pr...
HEAT+MASS TRANSFER:FUND.+APPL.
Consider a subsonic compressible flow in cartesian coordinates where the velocity potential is given by (x,y)=V...
Fundamentals of Aerodynamics
What types of polymers are most commonly blow molded?
DeGarmo's Materials and Processes in Manufacturing
What is the importance of modeling in engineering? How are the mathematical models for engineering processes pr...
Heat and Mass Transfer: Fundamentals and Applications
Knowledge Booster


Learn more about
Need a deep-dive on the concept behind this application? Look no further. Learn more about this topic, mechanical-engineering and related others by exploring similar questions and additional content below.Similar questions
- 3. Platinum and gold are completely soluble in both the liquid and solid states. The melting point of platinum is 3225°F and that of gold is 1945°F. An alloy containing 40% gold starts to solidify at 2910°F by separating crystals of 15 percent gold in solid. An alloy containing 70% gold starts to solidify at 2550°F by separating crystals of 37% gold in solid. Draw the equilibrium diagram to scale on a piece of graph paper and label all points, lines and areas.arrow_forward3. Platinum and gold are completely soluble in both the liquid and solid states. The melting point of platinum is 3225°F and that of gold is 1945°F. An alloy containing 40% gold starts to solidify at 2910°F by separating crystals of 15 percent gold in solid. An alloy containing 70% gold starts to solidify at 2550°F by separating crystals of 37% gold in solid. Draw the equilibrium diagram to scale on a piece of graph paper and label all points, lines and areas. For an alloy containing 70% gold (a) give the temperature of initial and final solidification. (b) Give the chemical composition and relative amounts of the phases present at 2440°F.arrow_forwardIn the region indicated with arrows in the phase diagram shown below (above the upper line), which of the following statements are true: 1300 - L (liquid) O b. O C. T(°C) 1200 20 30 ↑ wt% Ni 40 There are solid grains mixed with a liquid phase There is no solid fraction in the material liquidus solidus α (solid) Select one or more: a. The proportion of alpha phase increases going from right to left at a fixed temperature. 50 Od. The proportion of "L" phase increases going from right to left at a fixed temperature O e. The composition of the phase is pure liquidarrow_forward
- Tma X Liquidus mg All Liquid A Liquid B+Liquid T TE A+B (all solid) Solidus A Figure 1 Study the following terms and phase diagram, fill in the blanks as indicated. Refer to the figure above. Melting point is a physical property of a pure organic solid and is defined as the temperature at which the vapor pressure of the solid and liquid are equal. A pure solid melt reproducibly over a narrow range of temperatures. Above is a two-component phase diagram for two hypothetical compounds A and B. а. indicates the melting point of pure solid A. b. _indicates the melting point of pure solid B. С. _indicates the melting point of a 80:20 mixture of A and B respectively. d. indicates the melting point of a 55:45 mixture of A and B respectively. Eutectic composition is a mixture of compounds with a specific chemical composition that solidifies at a lower temperature than any other composition. е. _indicates the eutectic temperature for these two compounds f. A: B indicates the composition of A…arrow_forwardProblem 3 Given here are the solidus and liquidus tem- peratures for the copper-gold system. Con- struct the phase diagram for this system and label each region. Composition (wt% Au) 0 20 40 60 80 90 95 100 Solidus Liquidus Temperature (°C) Temperature (°C) 1085 1019 972 934 911 928 974 1064 1085 1042 996 946 911 942 984 1064arrow_forwardExercises: Sketch the phase diagram of a substance with the following points on the phase diagram: a triple point at 0.5 atm and 150 K; a normal melting point at 175 K; a normal boiling point at 350 K; and a critical point at 2.0 atm and 450 K. The solid liquid line is “normal” (meaning positive sloping). 1. Label the area 1, 2, and 3, and points T and C on the diagram. 2. Describe what one would see at pressures and temperatures above 2.0 atm and 450 K. 3. Describe the phase changes from 50 K to 250 K at 1.5 atm. 4. What exists in a system that is at 1 atm and 350 K? 5. What exists in a system that is at 1 atm and 175 K? Sketch the cooling curve of a substance with the following points: (A) 85 OC and 0 min, (B) 60 OC and 2 min, (C) 60 OC and 5 min, (D) 20 OC and 8 min, and (E) 20 OC and 11 min. Label each line 1, 2, 3, and 4 and each point A, B, C, D, and E. 1. What phase(s) exist at each of the numbered sections? 2. At what…arrow_forward
- The following is a hypothetical binary phase diagram with various temperatures highlighted as (T) where n corresponds to a numeric value. Use the diagram to L T2 answer the following questions: 1. How many solid phases are there in the T4 diagram? Ans.:_ 2. Identify the melting point of A & B? Ans: m, is & mg is T7 3. How many invariant points are there? Write To the reactions. Tu A WB Temperature toarrow_forward1. Visualize a substance with the following points on the phase diagram: a triplepoint at 0.05 atm and 150 K; a normal melting point at 175 K; a normal boiling pointat 350 K; and a critical point at 2.0 atm and 450 K. The solid liquid line is “normal”(meaning positive sloping). For this, complete the following:a. Roughly sketch the phase diagram, using units of atmosphere and Kelvin. Labelthe area 1, 2, and 3, and points T and C on the diagram.b. Describe what one would see at pressures and temperatures above 2.0 atmand 450 K.c. Describe the phase changes from 50 K to 250 K at 1.5 atm.d. What exists in a system that is at 1 atm and 350 K?e. What exists in a system that is at 1 atm and 175 K?2. Based from the phase diagrams of water and carbon dioxide, answer thefollowing questions and justify your answers: 1. You have ice at 263 K (-10.0 oC)and 1.0 atm. What could you do to make the ice sublime? 2. A sample of dry ice(solid CO2) is cooled to 173 K (-100.0 oC), and is set on a table at…arrow_forwardUse the answers in the table to draw the phase diagrams and locate the phase for each row of the table on the diagramarrow_forward
- Given the Cu-Zn phase diagram below, determine the amount of the phase/s present of a 75 wt% Zn -25 wt% Cu alloy for the following temperatures. Indicate the required composition for each temperature in the diagram. Round off your final answers up to two decimal places. Show your solutions completely and neatly and follow the table format below, Temperature Phase/s present Phase composition Relative amount 600 °C 570 °C y+ L 700 1200 8+L L 600 P 598°C 560°C 570 |1000 e + L y +e 500 60 68.6 70 74.3 75 78.2 80 90 Composition (wt % Zn) Temperature (°C) ta Temperature (°F)arrow_forwardi) Draw the phase diagram of a binary A (850 °C) and B (870 °C) system using below given information. • A and B are completely soluble in liquid phase. • B has no solid solubility in A. • Solid solubility of A in B at room temperature is 5 % and its maximum value is 20 %. • Eutectic point: 55 % B; 550 °C ii) for an alloy for which 55% Barrow_forward4a Describe the technique of creating an orientation map (OM) of a sample through EBSD system. Hint: the schematics presenting the EBSD technique is shown below: Electron beam EBSD pattern Diffraction CCD Camera 70 Sample SEM image 4b Schematic illustration of examples showing the structural modifications for strengthening of alloy shown in A and B. Just write the name of the strengthening mechanism shown in A and B. A Solute atoms Precipitates & dispersed particles dislocations Interacting B. Grain 2 Grain 2 Grain 1 GB Grain 1arrow_forwardarrow_back_iosSEE MORE QUESTIONSarrow_forward_ios
Recommended textbooks for you
 Elements Of ElectromagneticsMechanical EngineeringISBN:9780190698614Author:Sadiku, Matthew N. O.Publisher:Oxford University Press
 Mechanics of Materials (10th Edition)Mechanical EngineeringISBN:9780134319650Author:Russell C. HibbelerPublisher:PEARSON
 Thermodynamics: An Engineering ApproachMechanical EngineeringISBN:9781259822674Author:Yunus A. Cengel Dr., Michael A. BolesPublisher:McGraw-Hill Education
 Control Systems EngineeringMechanical EngineeringISBN:9781118170519Author:Norman S. NisePublisher:WILEY
 Mechanics of Materials (MindTap Course List)Mechanical EngineeringISBN:9781337093347Author:Barry J. Goodno, James M. GerePublisher:Cengage Learning
 Engineering Mechanics: StaticsMechanical EngineeringISBN:9781118807330Author:James L. Meriam, L. G. Kraige, J. N. BoltonPublisher:WILEY
Elements Of Electromagnetics
Mechanical Engineering
ISBN:9780190698614
Author:Sadiku, Matthew N. O.
Publisher:Oxford University Press
Mechanics of Materials (10th Edition)
Mechanical Engineering
ISBN:9780134319650
Author:Russell C. Hibbeler
Publisher:PEARSON
Thermodynamics: An Engineering Approach
Mechanical Engineering
ISBN:9781259822674
Author:Yunus A. Cengel Dr., Michael A. Boles
Publisher:McGraw-Hill Education
Control Systems Engineering
Mechanical Engineering
ISBN:9781118170519
Author:Norman S. Nise
Publisher:WILEY
Mechanics of Materials (MindTap Course List)
Mechanical Engineering
ISBN:9781337093347
Author:Barry J. Goodno, James M. Gere
Publisher:Cengage Learning
Engineering Mechanics: Statics
Mechanical Engineering
ISBN:9781118807330
Author:James L. Meriam, L. G. Kraige, J. N. Bolton
Publisher:WILEY
Thermodynamics - Chapter 3 - Pure substances; Author: Engineering Deciphered;https://www.youtube.com/watch?v=bTMQtj13yu8;License: Standard YouTube License, CC-BY