
Holt Mcdougal Larson Algebra 2: Student Edition 2012
1st Edition
ISBN: 9780547647159
Author: HOLT MCDOUGAL
Publisher: HOLT MCDOUGAL
expand_more
expand_more
format_list_bulleted
Expert Solution & Answer
Chapter SR32, Problem 12P
Solution
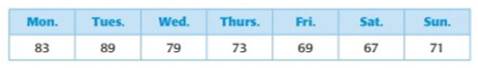
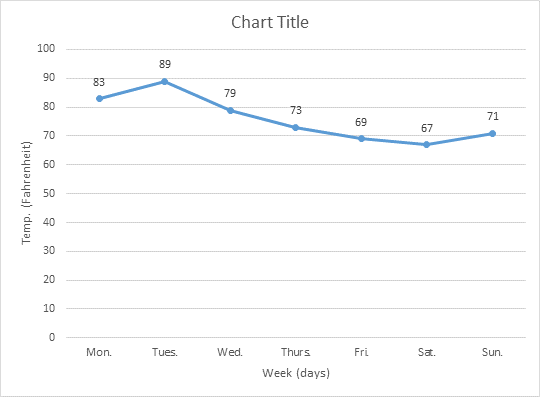
The table below shows the high temperatures in degree Fahrenheit for one week. Display the data in a line graph.
Line graph drawn below.
Given:
The given table.
Concept used:
- A line graph—also known as a line plot or a line chart—is a graph that uses lines to connect individual data points.
- A line graph displays quantitative values over a specified time interval.
Calculation:
The given table is −

The line graph of the given table is -
Chapter SR32 Solutions
Holt Mcdougal Larson Algebra 2: Student Edition 2012
Knowledge Booster

Recommended textbooks for you
 Algebra and Trigonometry (6th Edition)AlgebraISBN:9780134463216Author:Robert F. BlitzerPublisher:PEARSON
 Contemporary Abstract AlgebraAlgebraISBN:9781305657960Author:Joseph GallianPublisher:Cengage Learning
 Linear Algebra: A Modern IntroductionAlgebraISBN:9781285463247Author:David PoolePublisher:Cengage Learning
 Algebra And Trigonometry (11th Edition)AlgebraISBN:9780135163078Author:Michael SullivanPublisher:PEARSON
 Introduction to Linear Algebra, Fifth EditionAlgebraISBN:9780980232776Author:Gilbert StrangPublisher:Wellesley-Cambridge Press
 College Algebra (Collegiate Math)AlgebraISBN:9780077836344Author:Julie Miller, Donna GerkenPublisher:McGraw-Hill Education
Algebra and Trigonometry (6th Edition)
Algebra
ISBN:9780134463216
Author:Robert F. Blitzer
Publisher:PEARSON
Contemporary Abstract Algebra
Algebra
ISBN:9781305657960
Author:Joseph Gallian
Publisher:Cengage Learning
Linear Algebra: A Modern Introduction
Algebra
ISBN:9781285463247
Author:David Poole
Publisher:Cengage Learning
Algebra And Trigonometry (11th Edition)
Algebra
ISBN:9780135163078
Author:Michael Sullivan
Publisher:PEARSON
Introduction to Linear Algebra, Fifth Edition
Algebra
ISBN:9780980232776
Author:Gilbert Strang
Publisher:Wellesley-Cambridge Press
College Algebra (Collegiate Math)
Algebra
ISBN:9780077836344
Author:Julie Miller, Donna Gerken
Publisher:McGraw-Hill Education