
Videos
a.
To find the difference in the bar graph if one more column of data were added.
a.
Explanation of Solution
The required data for the bar graph is given below-
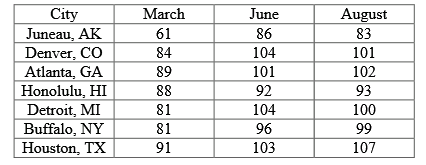
By using the above data, the following bar graph can be drawn-
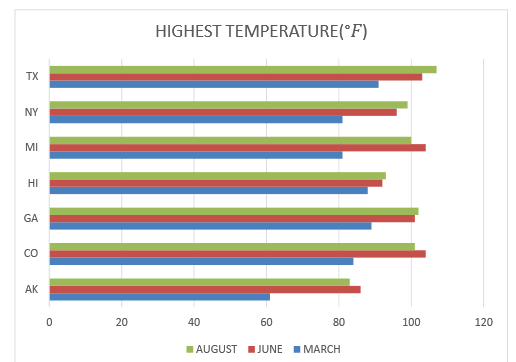
So, if one more column will be added to data, the bar graph will change. That means one more column will come in the above diagram.
b.
To find the difference in the bar graph if one more row of data were added.
b.
Explanation of Solution
So, if one more column will be added to data, the bar graph will change. That means in the diagram one more will be added.
Chapter SH Solutions
High School Math 2015 Common Core Algebra 1 Student Edition Grade 8/9
Additional Math Textbook Solutions
College Algebra
Intermediate Algebra (7th Edition)
Linear Algebra and Its Applications (5th Edition)
Introductory and Intermediate Algebra for College Students (5th Edition)
A Graphical Approach to College Algebra (6th Edition)
Intermediate Algebra for College Students (7th Edition)


 Algebra and Trigonometry (6th Edition)AlgebraISBN:9780134463216Author:Robert F. BlitzerPublisher:PEARSON
 Contemporary Abstract AlgebraAlgebraISBN:9781305657960Author:Joseph GallianPublisher:Cengage Learning
 Linear Algebra: A Modern IntroductionAlgebraISBN:9781285463247Author:David PoolePublisher:Cengage Learning
 Algebra And Trigonometry (11th Edition)AlgebraISBN:9780135163078Author:Michael SullivanPublisher:PEARSON
 Introduction to Linear Algebra, Fifth EditionAlgebraISBN:9780980232776Author:Gilbert StrangPublisher:Wellesley-Cambridge Press
 College Algebra (Collegiate Math)AlgebraISBN:9780077836344Author:Julie Miller, Donna GerkenPublisher:McGraw-Hill Education