
Path To College Mathematics, Books A La Carte Edition Plus Mylab Math Student Access Kit
1st Edition
ISBN: 9780134618555
Author: Elayn Martin-Gay
Publisher: PEARSON
expand_more
expand_more
format_list_bulleted
Videos
Textbook Question
Chapter R.4, Problem 17ES
The National Weather Service has exacting definitions for hurricanes; they are tropical storms with winds in excess of 74 mph. The following bar graph shows the number of hurricanes, by month, that have made landfall on the mainland United States between 1851 and 2016. Use this graph to answer Exercises 17 through 22. See Example 2. (Source: National Weather Service: National Hurricane Center)
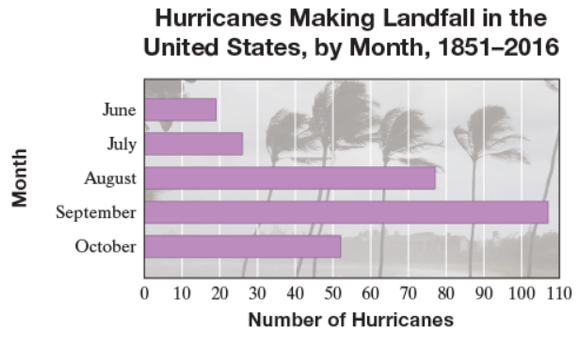
In which month did the most hurricanes make landfall in the United States?
Expert Solution & Answer
Want to see the full answer?
Check out a sample textbook solution
Students have asked these similar questions
The table to the right shows the six tallest mountains in a
country and their elevations. Use this table to find which
mountain is the tallest in that country.
The tallest mountain is
Mt. D.
Mt. E.
Mt. B.
Mt. C.
Mt. A.
Mt. F
Mountain
Mt. A
Mt. B
Mt C
Mt. D
Mt. E
Mt. F
Elevation (in feet)
4621
5401
5353
6555
4364
5071
Need help on letters A-G (all questions). Thank you.
On May 3, 1999, 59 tornadoes hit a
certain state in the largest tornado
outbreak ever recorded for that state.
Sixteen of these were classified as
strong (F2 or F3) or violent (F4 or F5).
Answer parts a through c below.
Length of
Length of
Length of
Path (miles) Intensity Path (miles) Intensity Path (miles) Intensity
F3
F3
F3
F2
F2
F3
F5
F2
F2
F3
45
5
9
4
37
6
13
0
I
8
6
15
40
1
20
45
NNIIN
F2
F2
F4
F4
a. Make a box-and-whisker plot of the data for length of path. Choose the correct plot below.
A.
O B.
O C.
F2
F3
15
8
14
3
45
Chapter R Solutions
Path To College Mathematics, Books A La Carte Edition Plus Mylab Math Student Access Kit
Ch. R.1 - Represent the shaded part of each geometric figure...Ch. R.1 - Represent the shaded part of each geometric figure...Ch. R.1 - Prob. 3ESCh. R.1 - Represent the shaded part of each geometric figure...Ch. R.1 - Prob. 5ESCh. R.1 - Write each number as product of primes. See...Ch. R.1 - Prob. 7ESCh. R.1 - Write each number as product of primes. See...Ch. R.1 - Write each number as product of primes. See...Ch. R.1 - Prob. 10ES
Ch. R.1 - Prob. 11ESCh. R.1 - Prob. 12ESCh. R.1 - Prob. 13ESCh. R.1 - Prob. 14ESCh. R.1 - Prob. 15ESCh. R.1 - Prob. 16ESCh. R.1 - Prob. 17ESCh. R.1 - Prob. 18ESCh. R.1 - Prob. 19ESCh. R.1 - Prob. 20ESCh. R.1 - Prob. 21ESCh. R.1 - Prob. 22ESCh. R.1 - Prob. 23ESCh. R.1 - Prob. 24ESCh. R.1 - Prob. 25ESCh. R.1 - Prob. 26ESCh. R.1 - Prob. 27ESCh. R.1 - Multiply or divided as indicated. Simplify the...Ch. R.1 - Multiply or divided as indicated. Simplify the...Ch. R.1 - Prob. 30ESCh. R.1 - Prob. 31ESCh. R.1 - Prob. 32ESCh. R.1 - Prob. 33ESCh. R.1 - Prob. 34ESCh. R.1 - Prob. 35ESCh. R.1 - Prob. 36ESCh. R.1 - Prob. 37ESCh. R.1 - Prob. 38ESCh. R.1 - Recall that the area of a plane figure is a...Ch. R.1 - Prob. 40ESCh. R.1 - Prob. 41ESCh. R.1 - Prob. 42ESCh. R.1 - Prob. 43ESCh. R.1 - Add or subtract as indicated. Write the answer in...Ch. R.1 - Prob. 45ESCh. R.1 - Prob. 46ESCh. R.1 - Prob. 47ESCh. R.1 - Prob. 48ESCh. R.1 - Prob. 49ESCh. R.1 - Prob. 50ESCh. R.1 - Prob. 51ESCh. R.1 - Prob. 52ESCh. R.1 - Prob. 53ESCh. R.1 - Prob. 54ESCh. R.1 - Prob. 55ESCh. R.1 - Prob. 56ESCh. R.1 - Prob. 57ESCh. R.1 - Prob. 58ESCh. R.1 - Prob. 59ESCh. R.1 - Prob. 60ESCh. R.1 - Prob. 61ESCh. R.1 - Prob. 62ESCh. R.1 - Prob. 63ESCh. R.1 - Prob. 64ESCh. R.1 - Prob. 65ESCh. R.1 - Prob. 66ESCh. R.1 - Prob. 67ESCh. R.1 - Prob. 68ESCh. R.1 - Prob. 69ESCh. R.1 - Prob. 70ESCh. R.1 - Prob. 71ESCh. R.1 - Prob. 72ESCh. R.1 - Prob. 73ESCh. R.1 - Prob. 74ESCh. R.1 - Prob. 75ESCh. R.1 - Prob. 76ESCh. R.1 - Prob. 77ESCh. R.1 - Mixed Practice Perform the following operations....Ch. R.1 - Prob. 79ESCh. R.1 - Prob. 80ESCh. R.1 - Mixed Practice Perform the following operations....Ch. R.1 - Prob. 82ESCh. R.1 - Prob. 83ESCh. R.1 - Prob. 84ESCh. R.1 - Prob. 85ESCh. R.1 - Mixed Practice Perform the following operations....Ch. R.1 - Prob. 87ESCh. R.1 - Prob. 88ESCh. R.1 - Mixed Practice 121433 Perform the following...Ch. R.1 - Prob. 90ESCh. R.1 - Prob. 91ESCh. R.1 - Prob. 92ESCh. R.1 - Prob. 93ESCh. R.1 - Prob. 94ESCh. R.1 - Prob. 95ESCh. R.1 - Prob. 96ESCh. R.1 - Prob. 97ESCh. R.1 - Prob. 98ESCh. R.1 - Prob. 99ESCh. R.1 - Prob. 100ESCh. R.1 - Prob. 101ESCh. R.1 - Prob. 102ESCh. R.1 - Prob. 103ESCh. R.1 - Prob. 104ESCh. R.1 - Prob. 105ESCh. R.1 - Prob. 106ESCh. R.1 - Prob. 107ESCh. R.1 - Prob. 108ESCh. R.1 - Prob. 109ESCh. R.1 - Prob. 110ESCh. R.2 - Write each decimal as a fraction. Do not simplify....Ch. R.2 - Prob. 2ESCh. R.2 - Prob. 3ESCh. R.2 - Prob. 4ESCh. R.2 - Prob. 5ESCh. R.2 - Prob. 6ESCh. R.2 - Prob. 7ESCh. R.2 - Prob. 8ESCh. R.2 - Prob. 9ESCh. R.2 - Prob. 10ESCh. R.2 - Prob. 11ESCh. R.2 - Prob. 12ESCh. R.2 - Prob. 13ESCh. R.2 - Prob. 14ESCh. R.2 - Prob. 15ESCh. R.2 - Prob. 16ESCh. R.2 - Prob. 17ESCh. R.2 - Prob. 18ESCh. R.2 - Prob. 19ESCh. R.2 - Prob. 20ESCh. R.2 - Prob. 21ESCh. R.2 - Prob. 22ESCh. R.2 - Multiply or divide as indicated. See Example 6 and...Ch. R.2 - Multiply or divide as indicated. See Example 6 and...Ch. R.2 - Mixed Practice Perform the indicated operation....Ch. R.2 - Mixed Practice Perform the indicated operation....Ch. R.2 - Mixed Practice Perform the indicated operation....Ch. R.2 - Mixed Practice Perform the indicated operation....Ch. R.2 - Mixed Practice Perform the indicated operation....Ch. R.2 - Mixed Practice Perform the indicated operation....Ch. R.2 - Mixed Practice 654.956.67 Perform the indicated...Ch. R.2 - Mixed Practice Perform the indicated operation....Ch. R.2 - Mixed Practice Perform the indicated operation....Ch. R.2 - Mixed Practice Perform the indicated operation....Ch. R.2 - Prob. 35ESCh. R.2 - Prob. 36ESCh. R.2 - Mixed Practice Perform the indicated operation....Ch. R.2 - Mixed Practice Perform the indicated operation....Ch. R.2 - Round each decimal to the given place value. See...Ch. R.2 - Round each decimal to the given place value. See...Ch. R.2 - Round each decimal to the given place value. See...Ch. R.2 - Round each decimal to the given place value. See...Ch. R.2 - Round each decimal to the given place value. See...Ch. R.2 - Round each decimal to the given place value. See...Ch. R.2 - Round each decimal to the given place value. See...Ch. R.2 - Round each decimal to the given place value. See...Ch. R.2 - Round each decimal to the given place value. See...Ch. R.2 - Round each decimal to the given place value. See...Ch. R.2 - Write each fraction as a decimal. If the decimal...Ch. R.2 - Write each fraction as a decimal. If the decimal...Ch. R.2 - Write each fraction as a decimal. If the decimal...Ch. R.2 - Write each fraction as a decimal. If the decimal...Ch. R.2 - Write each fraction as a decimal. If the decimal...Ch. R.2 - Write each fraction as a decimal. If the decimal...Ch. R.2 - Write each fraction as a decimal. If the decimal...Ch. R.2 - Write each fraction as a decimal. If the decimal...Ch. R.2 - Write each fraction as a decimal. If the decimal...Ch. R.2 - Write each fraction as a decimal. If the decimal...Ch. R.2 - Concept Extensions Solve. See the Concept Checks...Ch. R.2 - Concept Extensions Solve. See the Concept Checks...Ch. R.2 - Concept Extensions Solve. See the Concept Checks...Ch. R.2 - Concept Extensions Solve. See the Concept Checks...Ch. R.2 - The chart shows the average number of pounds of...Ch. R.2 - The chart shows the average number of pounds of...Ch. R.2 - The following graph is called a circle graph or...Ch. R.2 - The following graph is called a circle graph or...Ch. R.2 - The following graph is called a circle graph or...Ch. R.2 - The following graph is called a circle graph or...Ch. R.2 - The following graph is called a circle graph or...Ch. R.2 - The following graph is called a circle graph or...Ch. R.3 - Solve. See Example 1 and 2. In a survey of 100...Ch. R.3 - Solve. See Example 1 and 2. A basketball player...Ch. R.3 - One hundred adults were asked to name their...Ch. R.3 - One hundred adults were asked to name their...Ch. R.3 - One hundred adults were asked to name their...Ch. R.3 - One hundred adults were asked to name their...Ch. R.3 - Write each percent as a decimal. See Examples 3...Ch. R.3 - Write each percent as a decimal. See Examples 3...Ch. R.3 - Write each percent as a decimal. See Examples 3...Ch. R.3 - Write each percent as a decimal. See Examples 3...Ch. R.3 - Write each percent as a decimal. See Examples 3...Ch. R.3 - Write each percent as a decimal. See Examples 3...Ch. R.3 - Write each percent as a decimal. See Examples 3...Ch. R.3 - Write each percent as a decimal. See Examples 3...Ch. R.3 - Write each percent as a decimal. See Examples 3...Ch. R.3 - Write each percent as a decimal. See Examples 3...Ch. R.3 - Write each percent as a decimal. See Examples 3...Ch. R.3 - Write each percent as a decimal. See Examples 3...Ch. R.3 - Write each percent as a decimal. See Examples 3...Ch. R.3 - Write each percent as a decimal. See Examples 3...Ch. R.3 - Write each percent as a decimal. See Examples 3...Ch. R.3 - Write each percent as a decimal. See Examples 3...Ch. R.3 - Write each percent as a fraction or mixed number...Ch. R.3 - Write each percent as a fraction or mixed number...Ch. R.3 - Write each percent as a fraction or mixed number...Ch. R.3 - Write each percent as a fraction or mixed number...Ch. R.3 - Write each percent as a fraction or mixed number...Ch. R.3 - Write each percent as a fraction or mixed number...Ch. R.3 - Write each percent as a fraction or mixed number...Ch. R.3 - Write each percent as a fraction or mixed number...Ch. R.3 - Write each percent as a fraction or mixed number...Ch. R.3 - Write each percent as a fraction or mixed number...Ch. R.3 - Write each percent as a fraction or mixed number...Ch. R.3 - Write each percent as a fraction or mixed number...Ch. R.3 - Write each percent as a fraction or mixed number...Ch. R.3 - Write each percent as a fraction or mixed number...Ch. R.3 - Write each decimal as a percent. See Examples 13...Ch. R.3 - Write each decimal as a percent. See Examples 13...Ch. R.3 - Write each decimal as a percent. See Examples 13...Ch. R.3 - Write each decimal as a percent. See Examples 13...Ch. R.3 - Write each decimal as a percent. See Examples 13...Ch. R.3 - Write each decimal as a percent. See Examples 13...Ch. R.3 - Write each decimal as a percent. See Examples 13...Ch. R.3 - Write each decimal as a percent. See Examples 13...Ch. R.3 - Write each decimal as a percent. See Examples 13...Ch. R.3 - Write each decimal as a percent. See Examples 13...Ch. R.3 - Prob. 47ESCh. R.3 - Write each decimal as a percent. See Examples 13...Ch. R.3 - Write each decimal as a percent. See Examples 13...Ch. R.3 - Write each decimal as a percent. See Examples 13...Ch. R.3 - Write each fraction or mixed number as a percent....Ch. R.3 - Write each fraction or mixed number as a percent....Ch. R.3 - Write each fraction or mixed number as a percent....Ch. R.3 - Write each fraction or mixed number as a percent....Ch. R.3 - Write each fraction or mixed number as a percent....Ch. R.3 - Write each fraction or mixed number as a percent....Ch. R.3 - Write each fraction or mixed number as a percent....Ch. R.3 - Write each fraction or mixed number as a percent....Ch. R.3 - Write each fraction or mixed number as a percent....Ch. R.3 - Write each fraction or mixed number as a percent....Ch. R.3 - Write each fraction or mixed number as a percent....Ch. R.3 - Write each fraction or mixed number as a percent....Ch. R.3 - Write each fraction or mixed number as a percent....Ch. R.3 - Write each fraction or mixed number as a percent....Ch. R.3 - Write each fraction as a percent. Round to the...Ch. R.3 - Write each fraction as a percent. Round to the...Ch. R.3 - Write each fraction as a percent. Round to the...Ch. R.3 - Write each fraction as a percent. Round to the...Ch. R.3 - Mixed Practice Complete each table. See Example 1...Ch. R.3 - Mixed Practice Complete each table. See Example 1...Ch. R.3 - Mixed Practice Complete each table. See Example 1...Ch. R.3 - Mixed Practice Complete each table. See Example 1...Ch. R.3 - Write each percent as a decimal and a fraction....Ch. R.3 - Write each percent as a decimal and a fraction....Ch. R.3 - Write each percent as a decimal and a fraction....Ch. R.3 - Write each percent as a decimal and a fraction....Ch. R.3 - Write each percent as a decimal and a fraction....Ch. R.3 - Write each percent as a decimal and a fraction....Ch. R.3 - In Exercises 79 through 82, write the percent from...Ch. R.3 - In Exercises 79 through 82, write the percent from...Ch. R.3 - In Exercises 79 through 82, write the percent from...Ch. R.3 - In Exercises 79 through 82, write the percent from...Ch. R.3 - Solve. See Examples 21 and 22. In a particular...Ch. R.3 - Solve. See Examples 21 and 22. The United States'...Ch. R.3 - Solve. See Examples 21 and 22. The mirrors on the...Ch. R.3 - Solve. See Examples 21 and 22. In a particular...Ch. R.3 - Solve. See Examples 21 and 22. The U.S. Postal...Ch. R.3 - Solve. See Examples 21 and 22. In the United...Ch. R.3 - Concept Extensions Solve. See the Concept Checks...Ch. R.3 - Concept Extensions 0.5269, Solve. See the Concept...Ch. R.3 - Concept Extensions Solve. See the Concept Checks...Ch. R.3 - Concept Extensions Solve. See the Concept Checks...Ch. R.3 - Recall that 1=100 This means that 1 whole is 100....Ch. R.3 - Recall that 1=100 This means that 1 whole is 100....Ch. R.3 - What percent of the figure is shaded?Ch. R.3 - What percent of the figure is shaded?Ch. R.3 - Fill in the blanks. A fraction written as a...Ch. R.3 - Fill in the blanks. A decimal written as a percent...Ch. R.3 - Write each fraction as a decimal and then Mite...Ch. R.3 - Write each fraction as a decimal and then Mite...Ch. R.3 - The bar graph shows the predicted fastest-growing...Ch. R.3 - The bar graph shows the predicted fastest-growing...Ch. R.3 - The bar graph shows the predicted fastest-growing...Ch. R.3 - The bar graph shows the predicted fastest-growing...Ch. R.3 - The bar graph shows the predicted fastest-growing...Ch. R.3 - The bar graph shows the predicted fastest-growing...Ch. R.4 - The following pictograph shows the number of acres...Ch. R.4 - The following pictograph shows the number of acres...Ch. R.4 - The following pictograph shows the number of acres...Ch. R.4 - The following pictograph shows the number of acres...Ch. R.4 - Prob. 5ESCh. R.4 - The following pictograph shows the number of acres...Ch. R.4 - The following pictograph shows the number of acres...Ch. R.4 - The following pictograph shows the number of acres...Ch. R.4 - The following pictograph shows the average number...Ch. R.4 - The following pictograph shows the average number...Ch. R.4 - The following pictograph shows the average number...Ch. R.4 - The following pictograph shows the average number...Ch. R.4 - The following pictograph shows the average number...Ch. R.4 - The following pictograph shows the average number...Ch. R.4 - The following pictograph shows the average number...Ch. R.4 - The following pictograph shows the average number...Ch. R.4 - The National Weather Service has exacting...Ch. R.4 - The National Weather Service has exacting...Ch. R.4 - The National Weather Service has exacting...Ch. R.4 - The National Weather Service has exacting...Ch. R.4 - The National Weather Service has exacting...Ch. R.4 - The National Weather Service has exacting...Ch. R.4 - The following horizontal bar graph shows a recent...Ch. R.4 - The following horizontal bar graph shows a recent...Ch. R.4 - The following horizontal bar graph shows a recent...Ch. R.4 - The following horizontal bar graph shows a recent...Ch. R.4 - The following horizontal bar graph shows a recent...Ch. R.4 - The following horizontal bar graph shows a recent...Ch. R.4 - Use the information given to draw a vertical bar...Ch. R.4 - Use the information given to draw a vertical bar...Ch. R.4 - Prob. 31ESCh. R.4 - Prob. 32ESCh. R.4 - The histogram to the right shows the number of...Ch. R.4 - The histogram to the right shows the number of...Ch. R.4 - Prob. 35ESCh. R.4 - The histogram to the right shows the number of...Ch. R.4 - Prob. 37ESCh. R.4 - The histogram to the right shows the number of...Ch. R.4 - The histogram to the right shows the number of...Ch. R.4 - The histogram to the right shows the number of...Ch. R.4 - The histogram to the right shows the number of...Ch. R.4 - The histogram to the right shows the number of...Ch. R.4 - Prob. 43ESCh. R.4 - The following histogram shows the ages of...Ch. R.4 - The following histogram shows the ages of...Ch. R.4 - The following histogram shows the ages of...Ch. R.4 - The following histogram shows the ages of...Ch. R.4 - The following histogram shows the ages of...Ch. R.4 - Prob. 49ESCh. R.4 - The following histogram shows the ages of...Ch. R.4 - The following list shows the golf scores for an...Ch. R.4 - The following list shows the golf scores for an...Ch. R.4 - Prob. 53ESCh. R.4 - Prob. 54ESCh. R.4 - Twenty-five people in a survey were asked to give...Ch. R.4 - Prob. 56ESCh. R.4 - Prob. 57ESCh. R.4 - Prob. 58ESCh. R.4 - Prob. 59ESCh. R.4 - Prob. 60ESCh. R.4 - Use the frequency distribution table from...Ch. R.4 - Use the frequency distribution table from...Ch. R.4 - Prob. 63ESCh. R.4 - Beach Soccer World Cup is now held every two...Ch. R.4 - Prob. 65ESCh. R.4 - Beach Soccer World Cup is now held every two...Ch. R.4 - Beach Soccer World Cup is now held every two...Ch. R.4 - Prob. 68ESCh. R.4 - Prob. 69ESCh. R.4 - Beach Soccer World Cup is now held every two...Ch. R.4 - The following circle graph is a result of...Ch. R.4 - The following circle graph is a result of...Ch. R.4 - Prob. 73ESCh. R.4 - The following circle graph is a result of...Ch. R.4 - Prob. 75ESCh. R.4 - The following circle graph is a result of...Ch. R.4 - The following circle graph shows the percent of...Ch. R.4 - The following circle graph shows the percent of...Ch. R.4 - Prob. 79ESCh. R.4 - The following circle graph shows the percent of...Ch. R.4 - Prob. 81ESCh. R.4 - The total amount of land from the continents is...Ch. R.4 - Prob. 83ESCh. R.4 - The total amount of land from the continents is...Ch. R.4 - Prob. 85ESCh. R.4 - The following circle graph shows the percent of...Ch. R.4 - The following circle graph shows the percent of...Ch. R.4 - The following circle graph shows the percent of...Ch. R.4 - Prob. 89ESCh. R.4 - If this has 125,600 books, find how many books are...Ch. R.4 - Prob. 91ESCh. R.4 - If this has 125,600 books, find how many books are...Ch. R.4 - Prob. 93ESCh. R.4 - If this has 125,600 books, find how many books are...Ch. R.4 - Concept Extensions The following double line graph...Ch. R.4 - Prob. 96ESCh. R.4 - Prob. 97ESCh. R.4 - Concept Extensions The following double line graph...Ch. R.4 - Concept Extensions The following double line graph...Ch. R.4 - Concept Extensions The following double line graph...Ch. R.4 - Concept Extensions The following double line graph...Ch. R.4 - Concept Extensions The following double line graph...Ch. R.4 - Prob. 103ESCh. R.4 - The following circle graph shows the relative...Ch. R.4 - Prob. 105ESCh. R.4 - These oceans together make up 264,489,800 square...Ch. R.4 - Prob. 107ESCh. R.4 - These oceans together make up 264,489,800 square...Ch. R.4 - The following circle graph summarizes the results...Ch. R.4 - The following circle graph summarizes the results...Ch. R.4 - The following circle graph summarizes the results...Ch. R.4 - The following circle graph summarizes the results...Ch. R.4 - The following circle graph summarizes the results...Ch. R.4 - The following circle graph summarizes the results...Ch. R.4 - See the Concept Checks in this section. Can the...Ch. R.4 - True or false? The smaller a sector in a circle...Ch. R - Chapter R Vocabulary Check Fill in each blank with...Ch. R - Prob. 2VCCh. R - Chapter R Vocabulary Check Fill in each blank with...Ch. R - Prob. 4VCCh. R - Prob. 5VCCh. R - Prob. 6VCCh. R - Prob. 7VCCh. R - Prob. 8VCCh. R - Prob. 9VCCh. R - Prob. 10VCCh. R - Chapter R Vocabulary Check Fill in each blank with...Ch. R - Chapter R Vocabulary Check Fill in each blank with...Ch. R - Prob. 13VCCh. R - Prob. 14VCCh. R - Prob. 15VCCh. R - Prob. 16VCCh. R - Prob. 1RCh. R - (R.1) Write the number as product of prime...Ch. R - Prob. 3RCh. R - Perform the indicated operations. Write results in...Ch. R - Prob. 5RCh. R - Perform the indicated operations. Write results in...Ch. R - Perform the indicated operations. Write results in...Ch. R - Perform the indicated operations. Write results in...Ch. R - Perform the indicated operations. Write results in...Ch. R - Perform the indicated operations. Write results in...Ch. R - Each circle represents a whole, or 1. Determine...Ch. R - Each circle represents a whole, or 1. Determine...Ch. R - Find the area and the perimeter of each figure.Ch. R - Find the area and the perimeter of each figure.Ch. R - What was the total weigh of the boy octuplets?Ch. R - What was the total weight of the girl octuplets?Ch. R - Prob. 17RCh. R - Which baby weighed the most?Ch. R - Prob. 19RCh. R - How much more did the heaviest baby weigh than the...Ch. R - Prob. 21RCh. R - Write each decimal as a fraction. Do not simplify....Ch. R - Prob. 23RCh. R - Prob. 24RCh. R - Perform each indicated operation. 184.62Ch. R - Prob. 26RCh. R - Prob. 27RCh. R - Prob. 28RCh. R - Prob. 29RCh. R - Perform each indicated operation. 0.0613.8Ch. R - Prob. 31RCh. R - Round each decimal to given place value. 25.6293,...Ch. R - Prob. 33RCh. R - Prob. 34RCh. R - Write each fraction as a decimal. If the decimal...Ch. R - Write each fraction as a decimal. If the decimal...Ch. R - (R.3) Solve. In a survey of 100 adults, 37...Ch. R - Prob. 38RCh. R - Write each percent as a decimal. 26Ch. R - Write each percent as a decimal. 75Ch. R - Prob. 41RCh. R - Write each percent as a decimal. 1.5Ch. R - Prob. 43RCh. R - Write each percent as a decimal. 400Ch. R - Prob. 45RCh. R - Write each percent as a decimal. 85.34Ch. R - Prob. 47RCh. R - Write each decimal as a percent. 0.055Ch. R - Prob. 49RCh. R - Prob. 50RCh. R - Prob. 51RCh. R - Prob. 52RCh. R - Prob. 53RCh. R - Prob. 54RCh. R - Prob. 55RCh. R - Prob. 56RCh. R - Prob. 57RCh. R - Write each percent as a fraction or mixed number...Ch. R - Prob. 59RCh. R - Write each percent as a fraction or mixed number...Ch. R - Prob. 61RCh. R - Prob. 62RCh. R - Prob. 63RCh. R - Write each fraction or mixed number as percent....Ch. R - Prob. 65RCh. R - Write each fraction or mixed number as percent....Ch. R - Prob. 67RCh. R - Prob. 68RCh. R - Write each fraction or mixed number as percent....Ch. R - Write each fraction or mixed number as percent. 58Ch. R - (R.4) The following pictograph shows the number of...Ch. R - (R.4) The following pictograph shows the number of...Ch. R - Prob. 73RCh. R - Prob. 74RCh. R - Prob. 75RCh. R - Prob. 76RCh. R - The following bar graph shows the percent of...Ch. R - The following bar graph shows the percent of...Ch. R - The following bar graph shows the percent of...Ch. R - The following bar graph shows the percent of...Ch. R - Prob. 81RCh. R - The following line graph shows the total number of...Ch. R - Prob. 83RCh. R - The following line graph shows the total number of...Ch. R - The following line graph shows the total number of...Ch. R - The following line graph shows the total number of...Ch. R - Prob. 87RCh. R - Prob. 88RCh. R - Prob. 89RCh. R - The following histogram shows the hours worked per...Ch. R - Prob. 91RCh. R - Following is a list of monthly record high...Ch. R - Following is a list of monthly record high...Ch. R - Use the table from Exercises 91-93 to draw a...Ch. R - Prob. 95RCh. R - The following circle graph shows a familys $4000...Ch. R - Prob. 97RCh. R - The following circle graph shows a familys $4000...Ch. R - The following circle graph shows a familys $4000...Ch. R - The following circle graph shows a familys $4000...Ch. R - Prob. 101RCh. R - In a recent year, there were approximately 62...Ch. R - Prob. 103RCh. R - In a recent year, there were approximately 62...Ch. R - Prob. 1TCh. R - Prob. 2TCh. R - Prob. 3TCh. R - Prob. 4TCh. R - Perform each indicated operation and simplify....Ch. R - Prob. 6TCh. R - Prob. 7TCh. R - Prob. 8TCh. R - Prob. 9TCh. R - Prob. 10TCh. R - Prob. 11TCh. R - Prob. 12TCh. R - Prob. 13TCh. R - Prob. 14TCh. R - Prob. 15TCh. R - Prob. 16TCh. R - Prob. 17TCh. R - Prob. 18TCh. R - Prob. 19TCh. R - Prob. 20TCh. R - Prob. 21TCh. R - Prob. 22TCh. R - Prob. 23TCh. R - Prob. 24TCh. R - Prob. 25TCh. R - Prob. 26TCh. R - Prob. 27TCh. R - Prob. 28TCh. R - Prob. 29TCh. R - Prob. 30TCh. R - Prob. 31TCh. R - Prob. 32TCh. R - Prob. 33TCh. R - Prob. 34TCh. R - Prob. 35TCh. R - Prob. 36TCh. R - Prob. 37TCh. R - Prob. 38TCh. R - Prob. 39TCh. R - Prob. 40T
Knowledge Booster


Learn more about
Need a deep-dive on the concept behind this application? Look no further. Learn more about this topic, subject and related others by exploring similar questions and additional content below.Similar questions
- Name the four characteristics of a good definition.arrow_forwardThe histogram shows the ages of passengers riding in a tour van. © 2020 StrongMind. Created using GeoGebra. How many passengers are under 45 years of age? Enter your answer as a number, like this: 42arrow_forwardThe average monthly residential gas bill for Black Hills Energy customers in Cheyenne, Wyoming is (Wyoming Public Service Commission website). How is the average monthly gas bill for a Cheyenne residence related to the square footage, number of rooms, and age of the residence? The following data show the average monthly gas bill for last year, square footage, number of rooms, and age for typical Cheyenne residences. Average Monthly Gas Number of Bill for Last Year Age Square Footage Rooms $70.20 16 2537 6 $81.33 2 3437 8 $45.86 27 976 6 $59.21 11 1713 7 $117.88 16 3979 11 $57.78 2 1328 7 $47.01 27 1251 6 $52.89 4 827 5 $32.90 12 645 4 $67.04 29 2849 5 $76.76 1 2392 7 $60.40 26 900 5 $44.07 14 1386 5 $26.68 20 1299 4 $62.70 17 1441 6 $45.37 13 562 4 $38.09 10 2140 4 $45.31 22 908 6 $52.45 24 1568 5 $96.11 27 1140 10…arrow_forward
- Name: Paola O1de MAT 142 Project #2 – Statistics The table below shows the alcohol consumption per capita for seventeen high-income countries in 2000 according to https://ourworldindata.org. Country Liters of Alcohol Consumption per Capita in 1980 Australia 9.7 Austria 11.1 2. 11.5 Belgium 7.6 4 Canada Denmark 9.8 Finland 5.1 France 13.3 7. Germany 12.7 Italy 10.8 eb vi t Japan 6.5 10 1 Netherlands 8.6 New Zealand 9.1 12 13 Norway 5.2 Sweden 5.9 1uら Switzerland 11.4 15 l6 United Kingdom 8 United States 7.7 17 1) Calculate the mean, median, mode, and standard deviation of the liters of alcohol consumption per capita for these 17 countries. Use your TI-84 calculator or Excel as necessary. If you calculate them by hand, include your work (neatly written on a separate sheet of paper!!). If you use Excel, include the Excel worksheet. If you use your TI-84, show what you’ve entered and the results you get. (You could take photos of your calculator and include those if you'd rather.) 9.1 Mean…arrow_forwardPlease answer B-D b. μ or p H0: =, <, >, or ≠ H1: =, <, >, or ≠ c. z or tarrow_forwardBased on the Bar Graph constructed, give a summary of what the data reveals.arrow_forward
- Naples, Florida, hosts a half-marathon (13.1-mile race) in January each year. The event attracts top runners from throughout the United States as well as from around the world. 22 men and 31 women entered the 19-24 age class. Finish times in minutes are as follows. Times are shown in order of finish. Finish Men Women Finish Men Women Finish Men Women 1 67.21 110.94 11 110.96 125.79 21 145.74 138.66 2 68.18 113.13 12 112.14 127.69 22 150.61 140.11 3 68.43 113.56 13 114.81 131.43 23 140.91 4 68.76 113.84 14 115.43 131.78 24 149.09 5 72.78 116.29 15 122.86 132.63 25 149.26 6 89.09 120.24 16 129.89 133.58 26 149.41 7 98.36 123.16 17 130.31 133.94 27 149.66 8 100.43 123.99 18 132.81 135.11 28 155.79 9 102.43 124.39 19 133.71 135.41 29 156.74 10 110.09 124.53 20 140.54 138.48 30 191.18 31 191.19 a. Compare the firstplace finish times for men and women. If the 53 men and women runners had competed as one group, in what place would…arrow_forwardShown in the table below are the one-way airfares between 5 cities5 . Create a graph showing this data. Honolulu Moscow London Cairo Seattle $159 $370 $654 $684 Honolulu $830 $854 $801 London $245 $323 Moscow $329arrow_forwardWhat would be the number of subscribers on the year 2022?arrow_forward
- Suppose a data set ranges from a low value of 29 and a high value of 62. Calculate the class width for a frequency table with 6 classes.arrow_forwardThe scores for a Prestatistics exam are given: 90 79 73 61 76 93 33 87 15 49 87 36 Construct a frequency table and relative frequency table. Start a 15 and use a class width of 10arrow_forwardPlease help me fill out the “freshman” part of the tablearrow_forward
arrow_back_ios
SEE MORE QUESTIONS
arrow_forward_ios
Recommended textbooks for you
 Holt Mcdougal Larson Pre-algebra: Student Edition...AlgebraISBN:9780547587776Author:HOLT MCDOUGALPublisher:HOLT MCDOUGAL
 Elementary Geometry For College Students, 7eGeometryISBN:9781337614085Author:Alexander, Daniel C.; Koeberlein, Geralyn M.Publisher:Cengage,
 Intermediate AlgebraAlgebraISBN:9781285195728Author:Jerome E. Kaufmann, Karen L. SchwittersPublisher:Cengage Learning
 Algebra for College StudentsAlgebraISBN:9781285195780Author:Jerome E. Kaufmann, Karen L. SchwittersPublisher:Cengage Learning
 Algebra: Structure And Method, Book 1AlgebraISBN:9780395977224Author:Richard G. Brown, Mary P. Dolciani, Robert H. Sorgenfrey, William L. ColePublisher:McDougal Littell
Holt Mcdougal Larson Pre-algebra: Student Edition...
Algebra
ISBN:9780547587776
Author:HOLT MCDOUGAL
Publisher:HOLT MCDOUGAL
Elementary Geometry For College Students, 7e
Geometry
ISBN:9781337614085
Author:Alexander, Daniel C.; Koeberlein, Geralyn M.
Publisher:Cengage,
Intermediate Algebra
Algebra
ISBN:9781285195728
Author:Jerome E. Kaufmann, Karen L. Schwitters
Publisher:Cengage Learning
Algebra for College Students
Algebra
ISBN:9781285195780
Author:Jerome E. Kaufmann, Karen L. Schwitters
Publisher:Cengage Learning
Algebra: Structure And Method, Book 1
Algebra
ISBN:9780395977224
Author:Richard G. Brown, Mary P. Dolciani, Robert H. Sorgenfrey, William L. Cole
Publisher:McDougal Littell
2.1 Introduction to inequalities; Author: Oli Notes;https://www.youtube.com/watch?v=D6erN5YTlXE;License: Standard YouTube License, CC-BY
GCSE Maths - What are Inequalities? (Inequalities Part 1) #56; Author: Cognito;https://www.youtube.com/watch?v=e_tY6X5PwWw;License: Standard YouTube License, CC-BY
Introduction to Inequalities | Inequality Symbols | Testing Solutions for Inequalities; Author: Scam Squad Math;https://www.youtube.com/watch?v=paZSN7sV1R8;License: Standard YouTube License, CC-BY