
Concept explainers
Videos
(a)
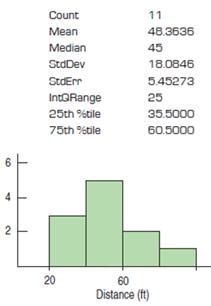
To construct: the 95 percent confidence interval for true distance.
(a)
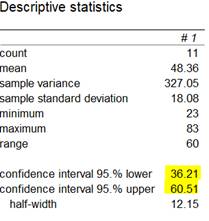
Answer to Problem 6RE
(36.21, 60.51)
Explanation of Solution
Given:
 Formula used:
Calculation:
(b)
To explain: the mean distance is plausibly 40 feet, yes or no on the basis of confidence interval.
(b)
Explanation of Solution
40 ft is plausible since 40 value comes in the 95 percent confidence interval
= (36.2142, 60.5130).
(c)
To find: the 99 percent confidence interval for true distance differ form the actual estimating in part (a) and discuss the brief, without actual estimating a new interval.
(c)
Explanation of Solution
The 99 percent confidence interval is longer than the confidence interval of 95 percent. This is because the 99 percent reliability factor t value is higher than the confidence level of 95 percent.
(d)
To explain: at the same confidence interval, how big a
(d)
Explanation of Solution
To raise the sample size by 4 times,
Chapter PVII Solutions
Stats: Modeling the World Nasta Edition Grades 9-12
Additional Math Textbook Solutions
Introductory Statistics (2nd Edition)
Essentials of Statistics, Books a la Carte Edition (5th Edition)
Introductory Statistics
Elementary Statistics
Elementary Statistics (13th Edition)
Basic Business Statistics, Student Value Edition


 MATLAB: An Introduction with ApplicationsStatisticsISBN:9781119256830Author:Amos GilatPublisher:John Wiley & Sons Inc
 Probability and Statistics for Engineering and th...StatisticsISBN:9781305251809Author:Jay L. DevorePublisher:Cengage Learning
 Statistics for The Behavioral Sciences (MindTap C...StatisticsISBN:9781305504912Author:Frederick J Gravetter, Larry B. WallnauPublisher:Cengage Learning
 Elementary Statistics: Picturing the World (7th E...StatisticsISBN:9780134683416Author:Ron Larson, Betsy FarberPublisher:PEARSON
 The Basic Practice of StatisticsStatisticsISBN:9781319042578Author:David S. Moore, William I. Notz, Michael A. FlignerPublisher:W. H. Freeman
 Introduction to the Practice of StatisticsStatisticsISBN:9781319013387Author:David S. Moore, George P. McCabe, Bruce A. CraigPublisher:W. H. Freeman