
Concept explainers
Videos
(a)
To explain is the sampling distribution model for the sample proportion likely to be normal.
(a)
Answer to Problem 2RE
Yes, the sampling distribution model for the sample proportion is likely to be normal.
Explanation of Solution
It is given in the question that medical literature says that about
(b)
To find out what is the
(b)
Answer to Problem 2RE
Mean is
Explanation of Solution
It is given in the question that medical literature says that about
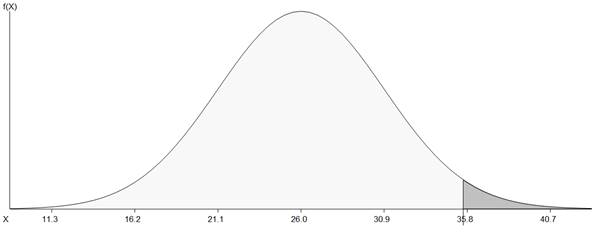
(c)
To sketch the sampling model, using the
(c)
Explanation of Solution
It is given in the question that medical literature says that about
(d)
To write a few sentences explaining what the model says about this professor’s class.
(d)
Explanation of Solution
It is given in the question that medical literature says that about
Chapter PV Solutions
Stats: Modeling the World Nasta Edition Grades 9-12
Additional Math Textbook Solutions
STATS:DATA+MODELS-W/DVD
Statistics for Psychology
Elementary Statistics
Fundamentals of Statistics (5th Edition)
Essentials of Statistics (6th Edition)
Elementary Statistics Using Excel (6th Edition)


 MATLAB: An Introduction with ApplicationsStatisticsISBN:9781119256830Author:Amos GilatPublisher:John Wiley & Sons Inc
 Probability and Statistics for Engineering and th...StatisticsISBN:9781305251809Author:Jay L. DevorePublisher:Cengage Learning
 Statistics for The Behavioral Sciences (MindTap C...StatisticsISBN:9781305504912Author:Frederick J Gravetter, Larry B. WallnauPublisher:Cengage Learning
 Elementary Statistics: Picturing the World (7th E...StatisticsISBN:9780134683416Author:Ron Larson, Betsy FarberPublisher:PEARSON
 The Basic Practice of StatisticsStatisticsISBN:9781319042578Author:David S. Moore, William I. Notz, Michael A. FlignerPublisher:W. H. Freeman
 Introduction to the Practice of StatisticsStatisticsISBN:9781319013387Author:David S. Moore, George P. McCabe, Bruce A. CraigPublisher:W. H. Freeman