Concept explainers
Videos
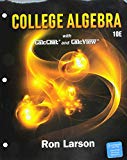
Minimum Wage Use the graph below, which shows the minimum wages in the United States (in dollars) from
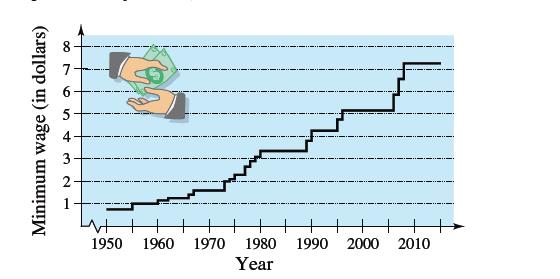
(a) Which decade shows the greatest increase in the minimum wage?
(b) Approximate the percent increases in the minimum wage from
(c) Use the percent increase from
(d) Do you believe that your prediction in part (c) is reasonable? Explain.

Trending nowThis is a popular solution!

Chapter P Solutions
Bundle: College Algebra, Loose-leaf Version, 10th + WebAssign Printed Access Card for Larson's College Algebra, 10th Edition, Single-Term


- Table 6 shows the year and the number ofpeople unemployed in a particular city for several years. Determine whether the trend appears linear. If so, and assuming the trend continues, in what year will the number of unemployed reach 5 people?arrow_forwardThe U.S. Census tracks the percentage of persons 25 years or older who are college graduates. That data forseveral years is given in Table 4[14]. Determine whether the trend appears linear. If so, and assuming the trendcontinues. in what year will the percentage exceed 35%?arrow_forwardIn Example 11, during which year did the sales reach $180 billion?arrow_forward

 Functions and Change: A Modeling Approach to Coll...AlgebraISBN:9781337111348Author:Bruce Crauder, Benny Evans, Alan NoellPublisher:Cengage Learning
 College AlgebraAlgebraISBN:9781305115545Author:James Stewart, Lothar Redlin, Saleem WatsonPublisher:Cengage Learning
 Algebra & Trigonometry with Analytic GeometryAlgebraISBN:9781133382119Author:SwokowskiPublisher:Cengage
 Trigonometry (MindTap Course List)TrigonometryISBN:9781337278461Author:Ron LarsonPublisher:Cengage Learning