
Concept explainers
Videos
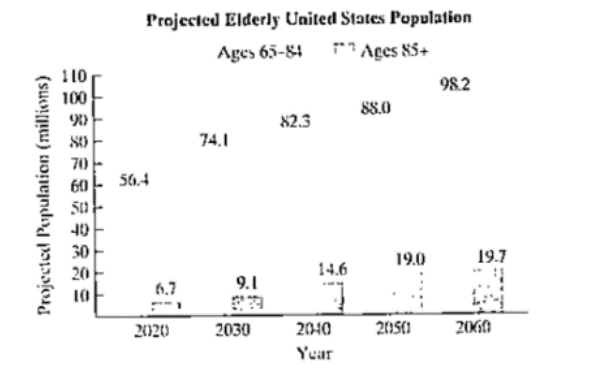
America is gelling older. The graph shows Ute projected elderly U.S. population for ages 65-84 and for ages 85 and older.
Source: U.S. Census Bureau
The formula
a. Use the $$$ to find the projected increase in the number of Americans ages 65-84, in millions, from 2030 to 2060. Express this difference in simplified radical form.
b. Use a calculator and write your answer in part (a) to the
nearest tenth. Dues this rounded decimal overestimate or underestimate the difference in the projected data shown by the bar graph on the previous page? By how much?
Want to see the full answer?
Check out a sample textbook solution
Chapter P Solutions
ALGEBRA+TRIGONOMETRY-MYMATHLAB


- U.S. Census data shows that the median price of new home in the United States in November 2014 was $280,900. This was $10,700 more than 14 times the price in November 1964. What was the median price of a new home in November 1964?arrow_forwardPredict the 2012 budget for an organization whose 2006 budget was 200 million dollars. Round the answer to two decimal places.arrow_forwardDuring 2010, the sales of vinyl records were 114% of the previous year’s sales. Sales were 2.8 million in 2010. (Source: Rollingstone.com).If this trend continues, how many vinyl records will be sold in the 5th year? Let 2010 = year 1.arrow_forward
- .A%3D -5arrow_forwardEstimate the year of production will fall below 70% of energy. y=-0.36x+94.2 x represents years after 1960arrow_forwardThe accompanying data represent the yearly amount of solar power installed (in megawatts) in a particular area from 2000 through 2008. The trend forecasting equations below were found, where X is the number of years after 2000. Complete parts (a) through (d) below. = -10.711 +28.9000X₁ ₁ = 22.70 +0.259X; +3.5801X? Click the icon to view the data table. a. Compute the standard error of the estimate (Syx) for each model. Linear Quadratic Syx 22.431 8.032 (Round to three decimal places as needed.) b. Compute the MAD for each model. Linear Quadratic MAD 64.222 66.873 (Round to three decimal places as needed.) c. On the basis of (a) and (b) and the principle of parsimony, which forecasting model would you select? The model with the smallest values of Syx and MAD should be used, which is the quadratic model.arrow_forward
- Find a graph or bar chart that represents a real situation where you could use a linear or exponential equation to model the data. Identify the type of function that is being modeled and why you believe it to be this type. Estimate the equation for the function.arrow_forwardAfter eating at a restaurant, it is customary to leave a tip t for the server for at least 15% of the cost of the meal c. Write a model to represent the amount of the tip based on the cost of the meal.arrow_forwardA town's population increases at a constant rate. In 2010 the population was 53,000. By 2012 the population had increased to 78,000. If this trend continues, predict the population in 2016. The population will be Number in 2016. Darrow_forward
- Help pleasearrow_forward| + 3. (5.7.12) On June 2, 2010 USA Today reported a story from Bloomberg News that said that the total price tag for the project to build the new F-35 Joint Strike Fighter would be 65% higher than the original $232 billion estimate. The cost now is estimated to be $382 billion. The total cost of each plane would be $112.4 million, up 81% from the original $62 million. The cost to produce each plane would be $92.4 million, about 85% higher than the original estimate of $50 million. a. Check the arithmetic to see that the three percentage increases reported are correct. b. Can you explain how the project cost can have increased by just 65% when the overall total per plane increased by 81% and the construction cost alone increased by almost 85%? 4. (5.7.3) Check that your own GPA from last semester has been computed correctly using the rules in effect at YSU. If you are in your first semester and don't yet have a GPA, imagine the grades you expect at the end of this semester and figure…arrow_forward5 Patrick recorded the daily changes of the value of a stock in dollars: -3.40, -8.09, -2.47, 1.86, and 3.55. What was the average daily change in the stock's value in dollars? Show your work. Solution:.arrow_forward
 Glencoe Algebra 1, Student Edition, 9780079039897...AlgebraISBN:9780079039897Author:CarterPublisher:McGraw Hill
 Elementary AlgebraAlgebraISBN:9780998625713Author:Lynn Marecek, MaryAnne Anthony-SmithPublisher:OpenStax - Rice University
 Holt Mcdougal Larson Pre-algebra: Student Edition...AlgebraISBN:9780547587776Author:HOLT MCDOUGALPublisher:HOLT MCDOUGAL
 Big Ideas Math A Bridge To Success Algebra 1: Stu...AlgebraISBN:9781680331141Author:HOUGHTON MIFFLIN HARCOURTPublisher:Houghton Mifflin Harcourt
 Mathematics For Machine TechnologyAdvanced MathISBN:9781337798310Author:Peterson, John.Publisher:Cengage Learning,