
Concept explainers
Videos
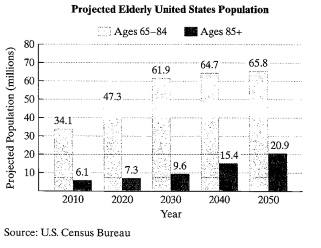
America is getting older. The graph shows the projected elderly U.S. population for ages 65–84 and for ages 85 and older.
The formula
a. Use the formula to find the projected increase in the number of Americans ages 65–84, in millions, from 2020 to 2050. Express this difference in simplified radical form.
b. Use a calculator and write your answer in part (a) to the nearest tenth. Does this rounded decimal overestimate or underestimate the difference in the projected data shown by the bar graph on the previous page? By how much?
Want to see the full answer?
Check out a sample textbook solution
Chapter P Solutions
EBK ALGEBRA AND TRIGONOMETRY


- Complete #1 pleasearrow_forwardIn Exercises 1–6, solve for x.arrow_forwardA picture supposedly painted by Vermeer (1632–1675) contains 98.4% of its carbon-14 (half-life 5730 years). From this information decide whether the picture is a fake. Explain your reasoning.Round your answer to two decimal places.arrow_forward
- Solve the variation problems in Exercises 68–73. 68. A company's profit varies directly as the number of products it sells. The company makes a profit of $1175 on the sale of 25 products. What is the company's profit when it sells 105 products? 69. The distance that a body falls from rest varies directly as the square of the time of the fall. If skydivers fall 144 feet in 3 seconds, how far will they fall in 10 seconds? 70. The pitch of a musical tone varies inversely as its wavelength. A tone has a pitch of 660 vibrations per second and a wavelength of 1.6 feet. What is the pitch of a tone that has a wavelength of 2.4 feet? 71. The loudness of a stereo speaker, measured in decibels, varies inversely as the square of your distance from the speaker. When you are 8 feet from the speaker, the loudness is 28 decibels. What is the loudness when you are 4 feet from the speaker? 72. The time required to assemble computers varies directly as the number of computers assembled and inversely as…arrow_forwardThe table shows the amount of money (in billions of dollars)Americans spent on their pets for the years shown below.arrow_forwardIn Exercises 7–12, describe the relationship between the two quantities.arrow_forward
- World Military Expenditure The following chart shows total military and arms trade expenditure from 2011–2020 (t = 1 represents 2011). †A bar graph titled "World military expenditure" has a horizontal t-axis labeled "Year since 2010" and a vertical axis labeled "$ (billions)". The bar graph has 10 bars. Each bar is associated with a label and an approximate value as listed below. 1: 1,800 billion dollars 2: 1,775 billion dollars 3: 1,750 billion dollars 4: 1,730 billion dollars 5: 1,760 billion dollars 6: 1,760 billion dollars 7: 1,850 billion dollars 8: 1,900 billion dollars 9: 1,950 billion dollars 10: 1,980 billion dollars (a) If you want to model the expenditure figures with a function of the form f(t) = at2 + bt + c, would you expect the coefficient a to be positive or negative? Why? HINT [See "Features of a Parabola" in this section.] We would expect the coefficient to be positive because the curve is concave up. We would expect the coefficient to be negative because the…arrow_forwardSuppose classmates who graduated in 2004 compared their median incomes ten years later. The bar graph displays the median income, in thousands of dollars, for each classmate during the time intervals from 2005‑2009 and 2010‑2014. For the individual with the largest dollar value increase in median income over the two time intervals, determine the amount of increase.arrow_forwardA city manage must predict the population of the city between the years 2000 and 2050 to make plans for new business expansions and housing developments. To determine the population growth, the city manager will use the formula y = ab x . What do the variables in this formula represent?arrow_forward
 Algebra & Trigonometry with Analytic GeometryAlgebraISBN:9781133382119Author:SwokowskiPublisher:Cengage