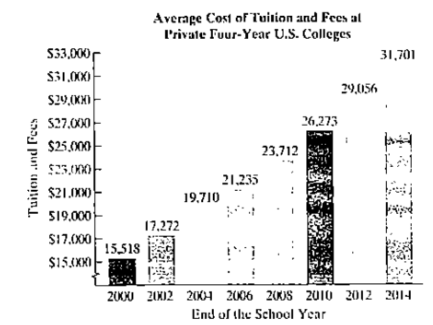
The bar graph shows the average cost of tuition and fees at private four-year colleges in the United States. Source: The College Board The formula T = 21x2 + 862x + 15,552 models the average cost of tuition and fees, T, at private U.S. colleges for the school year ending x years after 2000. Use this information to solve Exercises 131-132. a. Use the formula to find the average cost of tuition and fees at private U.S. colleges for the school year ending in 2012. b. By how much does the formula underestimate or overestimate the actual cost shown by the graph for the school year ending in 2012? c. Use the formula to project the average cost of tuition and fees at private U.S. colleges for the school year ending in 2022.
The bar graph shows the average cost of tuition and fees at private four-year colleges in the United States. Source: The College Board The formula T = 21x2 + 862x + 15,552 models the average cost of tuition and fees, T, at private U.S. colleges for the school year ending x years after 2000. Use this information to solve Exercises 131-132. a. Use the formula to find the average cost of tuition and fees at private U.S. colleges for the school year ending in 2012. b. By how much does the formula underestimate or overestimate the actual cost shown by the graph for the school year ending in 2012? c. Use the formula to project the average cost of tuition and fees at private U.S. colleges for the school year ending in 2022.
Solution Summary: The author analyzes how the model underestimates the value of the tuition fee.
The bar graph shows the average cost of tuition and fees at private four-year colleges in the United States.
Source: The College Board
The formula
T = 21x2 + 862x + 15,552
models the average cost of tuition and fees, T, at private U.S. colleges for the school year ending x years after 2000. Use this information to solve Exercises 131-132.
a. Use the formula to find the average cost of tuition and fees at private U.S. colleges for the school year ending in 2012.
b. By how much does the formula underestimate or overestimate the actual cost shown by the graph for the school year ending in 2012?
c. Use the formula to project the average cost of tuition and fees at private U.S. colleges for the school year ending in 2022.
The bar graph shows the average dormitory charges at public and private four-year U.S. colleges. Use the information displayed by the graph to solve,a. Use the numbers shown by the bar graph to find the total dormitory charges at private colleges for a four-year period from the school year ending in 2010 through the school year ending in 2013.
b. The model an = 198n + 5037 describes the dormitory charges at private colleges in academic year n, where n = 1 corresponds to the school year ending in 2010, n = 2 to the school year ending in 2011, and so on. Use this model and the formula for Sn to find the total dormitory charges at private colleges for a four-year period from the school year ending in 2010 through the school year ending in 2013. How does this compare with the actual sum you obtained in part (a)?
Solve Exercise 8.50
Please provide typed answers.
c) The amount of money M, in billions of dollars,
invested by venture capital firms during year x is
estimated by M = 1.95x -3886.45, where x is
any year from 2005 to 2008.
Find the year when $29.15 billion were invested.
Write your answers in complete sentences.
Need a deep-dive on the concept behind this application? Look no further. Learn more about this topic, algebra and related others by exploring similar questions and additional content below.


 Glencoe Algebra 1, Student Edition, 9780079039897...AlgebraISBN:9780079039897Author:CarterPublisher:McGraw Hill
 College AlgebraAlgebraISBN:9781305115545Author:James Stewart, Lothar Redlin, Saleem WatsonPublisher:Cengage Learning
 Holt Mcdougal Larson Pre-algebra: Student Edition...AlgebraISBN:9780547587776Author:HOLT MCDOUGALPublisher:HOLT MCDOUGAL
 Algebra: Structure And Method, Book 1AlgebraISBN:9780395977224Author:Richard G. Brown, Mary P. Dolciani, Robert H. Sorgenfrey, William L. ColePublisher:McDougal Littell
 Trigonometry (MindTap Course List)TrigonometryISBN:9781337278461Author:Ron LarsonPublisher:Cengage Learning