Application Exercises
The maximum heart rate, in beats per minute, that yon should achieve during exercise is 220 minus your age:
220 - a.
This algebraic expression gives maximum heart rate in terms of age, a.
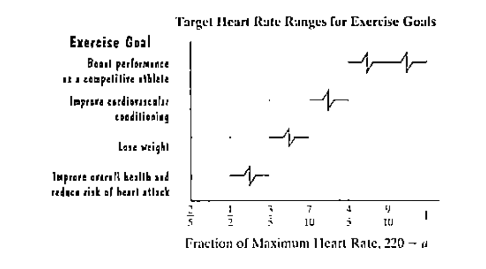
The following bar graph shows the target heart rate ranges for four types of exercise goals. The lower and upper limits of these ranges are fractions of the maximum heart rate, 220 - a. Exercises 129-130 are based on the information in the graph.

If your exercise goal is to improve overall health, the graph shows the following range for target heart rate, H, in beats per minute:
a. What is the lower limit of the heart rate range, in beats per minute, for a 30-year-old with this exercise goal?
b. What is the upper limit of the heart rate range, in beats per minute, for a 30-year-old with this exercise goal?
Want to see the full answer?
Check out a sample textbook solution
Chapter P Solutions
College Algebra
- An airplane flies from Naples, Italy, in a straight line to Rome, Italy, which is 120 kilometers north and 150 kilometers west of Naples. How far does the plane fly?arrow_forwardWhat is the height of this graph? There’s one rectangle missing. This graph represents silver in parts per million.arrow_forwardDetermine whether the statement given below makes sense or does not make sense, and explain your reasoning : "For each $1 increase in the price of a $300 plane ticket, an airline will lose 60 passengers, so if the ticket price is increased to $x, the decrease in passengers is modeled by 60(300 – x)."arrow_forward
- Illustrate the Quotient Rule ?arrow_forwardThe double bar graph shown below represents the number of vegetables harvested in July and August by one familly. For which vegetable was the number harvested in July closest to the number harvested in August? Number of Vegetables Harvested O Carrots O Com O Peppers O Potatoes O Cucumbers 40 35 30 25 20 15 10 Carrots Corn Peppers Potatoes Cucumbers July Augustarrow_forwardPlease help me answer a,b and c with complete solutionarrow_forward
- You are given a description of a situation. The situation involves a functioning relationship. a) Fill in the table. b) Write an algebraic rule that describes the relationship between the variables in the problem situation. c) What are the domain and range of this situation and what do they represent? Situation: Every time the dishwasher is run, it uses 25 gallons of water. Let x= the number of times the dishwasher is run. Let y= the number of gallons of water used. Table x y 0 2 4 6 7arrow_forwardwrite the matching equation to go with this functionarrow_forwardWrite your answer on a piece of paper. Make a table for x and y. Assign the numbers: 1, 2, 3, 4, 5 as the value of x. Use the table below as your guide then, determine the following: • Domain and Range • Function or Not Function Submit your answers in PDF Format 1 2 3 14 y Questions: A. y = 4x –1 B. y = 7x - 4 C.y = -2xarrow_forward
- The bar graph shows discretionary spending by full and part-time college students in some country from 2007 through 2013. The data in the graph can be modeled by the formula D=1.2x +1.6(x+40), where D represents discretionary spending among students, in billions of dollars, x years after 2007. According to the formula, how much money did college students spend in 2007? Does the model underestimate or overestimate the amount of discretionary spending displayed by the bar graph? By how much? Discretionary Spending Among Students $140- $120- 115 S100- 87 74 $80- 61 S60- $40 $20- 0- 2007 2009 2011 2013 The amount of money college students spent in 2007 according to the formula to the left is $ billion. (Type an integer or a decimal.) Does the model underestimate or overestimate the amount of discretionary spending displayed by the bar graph? Select the correct choice below and, if necessary, fill in the answer box to complete your choice. (Type an integer or a decimal) O A. Overestimates…arrow_forwardThe U.S. Geological Survey monitors and reports on earthquakes, providing daily real-time, worldwide earthquake lists. Some of the information for four of the 105 earthquakes of magnitude 1.5 or greater that occurred on May 10, 2013, is shown in the following table. Magnitude is given on the Richter scale and NST stands for the number of stations that reported the activity on the same earthquake. Complete parts (a) through (e) below. Time Magnitude Depth (km) NST Region 00:03:16 1.7 75.9 29 Alaska 04:59:11 1.7 134.9 18 Alaska 08:27:04 2.8 64.0 21 Alaska 23:30:09 4.2 10.0 34 China a. Identify the type of data provided by the information in the first column of the table. Also identify the variable under consideration. Quantitative, Continuous, Qualitative, Quantitative, Discrete, region where the earthquake occurred depth of the earthquake in kilometers number of stations reporting the earthquake…arrow_forwardFind Alan's average for a specific course/subject if his professor grades the students based on their scores on on four tests, a term paper, and a final examination. Each test counts as 15% of the course grade. The term paper counts as 20% of the course grade. The final examination counts as 20% of the course grade. Alan's test scores are 80, 78, 92, and 84, respectively, term paper's score is 84 and final examination's score is 88. Use the weighted mean formula.arrow_forward
 Glencoe Algebra 1, Student Edition, 9780079039897...AlgebraISBN:9780079039897Author:CarterPublisher:McGraw Hill
 Holt Mcdougal Larson Pre-algebra: Student Edition...AlgebraISBN:9780547587776Author:HOLT MCDOUGALPublisher:HOLT MCDOUGAL
 College Algebra (MindTap Course List)AlgebraISBN:9781305652231Author:R. David Gustafson, Jeff HughesPublisher:Cengage Learning
 Mathematics For Machine TechnologyAdvanced MathISBN:9781337798310Author:Peterson, John.Publisher:Cengage Learning,


