
Videos
To graph: The inequality
Explanation of Solution
Given:
The inequality is
Calculation:
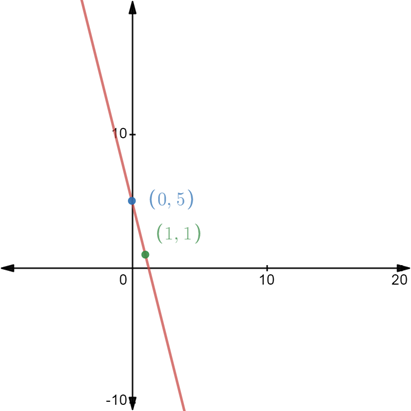
First plot the equation of line
Take some of points for the coordinates.
Consider x = 0,
Thus, the coordinate is (0, 5).
Consider x = 1,
Thus, the coordinate is (1, 1).
The graph of the equation can be drawn by joining these two coordinates as follows:
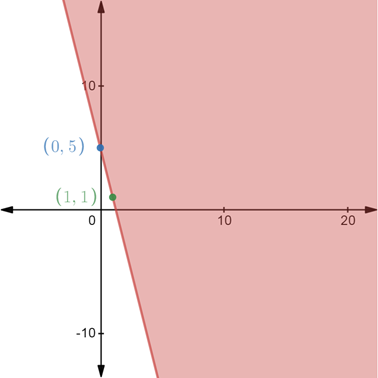
Now apply the inequality condition (greater than equal to) by shading the area above the line as follows:
Additional Math Textbook Solutions
Linear Algebra with Applications (9th Edition) (Featured Titles for Linear Algebra (Introductory))
College Algebra (10th Edition)
Differential Equations and Linear Algebra (4th Edition)
College Algebra
Introductory and Intermediate Algebra for College Students (5th Edition)
Linear Algebra with Applications (2-Download)


 Algebra and Trigonometry (6th Edition)AlgebraISBN:9780134463216Author:Robert F. BlitzerPublisher:PEARSON
 Contemporary Abstract AlgebraAlgebraISBN:9781305657960Author:Joseph GallianPublisher:Cengage Learning
 Linear Algebra: A Modern IntroductionAlgebraISBN:9781285463247Author:David PoolePublisher:Cengage Learning
 Algebra And Trigonometry (11th Edition)AlgebraISBN:9780135163078Author:Michael SullivanPublisher:PEARSON
 Introduction to Linear Algebra, Fifth EditionAlgebraISBN:9780980232776Author:Gilbert StrangPublisher:Wellesley-Cambridge Press
 College Algebra (Collegiate Math)AlgebraISBN:9780077836344Author:Julie Miller, Donna GerkenPublisher:McGraw-Hill Education