
a.
To evaluate the marginal revenue and Average revenue functions from the table given in the question.
a.
Explanation of Solution
Average revenue is the revenue which is obtained by dividing total revenue by quantity.
Marginal revenue is the additional revenue which is obtained by selling an extra unit of the product.
Formula to find the Marginal revenue (MR) and Average revenue (AR)
| Output | Total Revenue (TR) | Marginal Revenue | Average Revenue |
| 0 | 0 | - | - |
| 1 | 34 |
|
|
| 2 | 66 |
|
|
| 3 | 96 | 30 | 32 |
| 4 | 124 | 28 | 31 |
| 5 | 150 | 26 | 30 |
| 6 | 174 | 24 | 29 |
| 7 | 196 | 22 | 28 |
| 8 | 216 | 20 | 27 |
| 9 | 234 | 18 | 26 |
| 10 | 250 | 16 | 25 |
| 11 | 264 | 14 | 24 |
| 12 | 276 | 12 | 23 |
| 13 | 286 | 10 | 22 |
| 14 | 294 | 8 | 21 |
| 15 | 300 | 6 | 20 |
| 16 | 304 | 4 | 19 |
| 17 | 306 | 2 | 18 |
| 18 | 306 | 0 | 17 |
| 19 | 304 | -2 | 16 |
| 20 | 300 | -4 | 15 |
Introduction: Average revenue is revenue produced per unit of product sold. It plays a part in deciding the income for a company. The average revenue is less than the average (total) expense per unit income. An organization typically aims to generate the amount of production that maximizes income.
b.
To evaluate the marginal cost and Average cost functions from the table given in the question.
b.
Explanation of Solution
Formula to find the MC and AC are:
| Output | Total Cost (TC) | Marginal Cost | Average Revenue |
| 0 | 20 | - | - |
| 1 | 26 |
|
|
| 2 | 34 |
|
|
| 3 | 44 | 10 | 14.7 |
| 4 | 56 | 12 | 14.0 |
| 5 | 70 | 14 | 14.0 |
| 6 | 86 | 16 | 14.3 |
| 7 | 104 | 18 | 14.9 |
| 8 | 124 | 20 | 15.5 |
| 9 | 146 | 22 | 16.2 |
| 10 | 170 | 24 | 17.0 |
| 11 | 196 | 26 | 17.8 |
| 12 | 224 | 28 | 18.7 |
| 13 | 254 | 30 | 19.5 |
| 14 | 286 | 32 | 20.4 |
| 15 | 320 | 34 | 21.3 |
| 16 | 356 | 36 | 22.3 |
| 17 | 394 | 38 | 23.2 |
| 18 | 434 | 40 | 24.1 |
| 19 | 476 | 42 | 25.1 |
| 20 | 520 | 44 | 26.0 |
Introduction: The average cost method assigns a cost to inventory items based on the overall cost of the produced or manufactured goods over a period divided by the total number of products purchased or made. Often known as weighted-average method, is the average cost method.
c.
To evaluate the point where MR = MC and the output level in the graph that maximizes profits.
c.
Explanation of Solution
In economics, profit maximization is the short-term or long-term mechanism by which a firm can decide the levels of price, input, and production that lead to the highest benefit.
The graph is shown below:
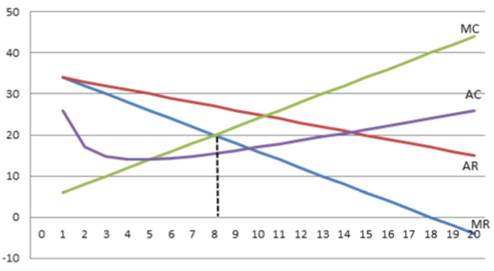
Marginal revenue equals to Marginal cost when Output (Q) = 8, where MC = MR =20
Introduction: Marginal revenue is the rise in revenue arising from the selling of one extra output unit. Although marginal revenue may remain constant for a certain level of production, the law of diminishing returns follows and inevitably slows down as the level of production increases.
d.
To evaluate the point where MR = MC and the output level in the graph that maximizes profits.s
d.
Explanation of Solution
The average cost method assigns a cost to inventory items based on the overall cost of the produced or manufactured goods over a period divided by the total number of products purchased or made. Often known as weighted-average method, is the average cost method.
In economics, profit maximization is the short-term or long-term mechanism by which a firm can decide the levels of price, input, and production that lead to the highest benefit.
Referring from the tables in part (a) and part (b) and the solution at Q = 8, the table is given below:
| Output | Marginal Cost | Marginal Revenue |
| 8 | 20 | 20 |
Introduction: Marginal revenue is the rise in revenue arising from the selling of one extra output unit. Although marginal revenue may remain constant for a certain level of production, the law of diminishing returns follows and inevitably slows down as the level of production increases. Perfectly competitive firms continue to generate production until marginal revenue is equal to marginal costs.
Want to see more full solutions like this?
Chapter B Solutions
Managerial Economics: Applications, Strategies and Tactics (MindTap Course List)

- On the graph input tool, change the number found in the Quantity Demanded field to determine the prices that correspond to the production of 0, 6, 12, 15, 18, 24, and 30 units of output. Calculate the total revenue for each of these production levels. Then, on the following graph, use the green points (triangle symbol) to plot the results. Calculate the total revenue if the firm produces 6 versus 5 units. Then, calculate the marginal revenue of the sixth unit produced. The marginal revenue of the sixth unit produced is________. Calculate the total revenue if the firm produces 12 versus 11 units. Then, calculate the marginal revenue of the 12th unit produced. The marginal revenue of the 12th unit produced is_________.arrow_forwardA startup software company has indicated its cost, c(x), and revenue, f(x), as given below, such that x is the number of lines of programing code (units in 1000 lines). c(x) = 80000 - 2(x-200)2 f(x) = (x-10)3 + (x+10)2 Find the marginal cost analytically, and draw its graph Find the marginal revenue analytically, and draw its graph Solve for the x point where marginal cost is equal to marginal revenue analytically. Comment why is this point significant analytically. Write the profit function and draw its graph Is the profit function concave up or concave down?arrow_forwardSuppose that the profit from the sale of Kisses and Kreams is given by the following, where x is the number of pounds of Kisses and y is the number of pounds of Kreams. P(x, y) = 10x + 6.6y - 0.001x² -0.025y² dollars You know from previous experience that, for such a profit function, profit will be maximized at the critical point of P(x,y). (a) Determine the amounts of Kisses and Kreams that will maximize profit. pounds of Kisses pounds of Kreams (b) What is the maximum profit? (Round your answer to two decimal places.) $arrow_forward
- Suppose the imaginary company of Roobek is a small, Reno-based American apparel manufacturer specializing in athleisure. The following table presents the brand’s total cost of production at several different quantities. Fill in the remaining cells of the following table. Quantity Total Cost Marginal Cost Fixed Cost Variable Cost Average Variable Cost Average Total Cost (Pairs) (Dollars) (Dollars) (Dollars) (Dollars) (Dollars per pair) (Dollars per pair) 0 60 — — 1 160 2 220 3 270 4 340 5 450 6 630 On the following graph, plot Douglas Fur’s average total cost (ATC) curve using the green points (triangle symbol). Next, plot its average variable cost (AVC) curve using the purple points (diamond symbol). Finally, plot its marginal cost (MC) curve using the orange points (square symbol). (Hint: For ATC…arrow_forwardSuppose the imaginary company of Roobek is a small, Reno-based American apparel manufacturer specializing in athleisure. The following table presents the brand’s total cost of production at several different quantities. Fill in the remaining cells of the following table. Quantity Total Cost Marginal Cost Fixed Cost Variable Cost Average Variable Cost Average Total Cost (Pairs) (Dollars) (Dollars) (Dollars) (Dollars) (Dollars per pair) (Dollars per pair) 0 120 — — 1 210 2 270 3 315 4 380 5 475 6 630arrow_forwardDouglas Fur is a small manufacturer of fake-fur boots in San Diego. The following table shows the company’s total cost of production at various production quantities. On the following graph, plot Douglas Fur’s average total cost (ATC) curve using the green points (triangle symbol). Next, plot its average variable cost (AVC) curve using the purple points (diamond symbol). Finally, plot its marginal cost (MC) curve using the orange points (square symbol). (Hint: For ATC and AVC, plot the points on the integer; for example, the ATC of producing one pair of boots is $210, so you should start your ATC curve by placing a green point at (1, 210). For MC, plot the points between the integers: For example, the MC of increasing production from zero to one pair of boots is $90, so you should start your MC curve by placing an orange square at (0.5, 90).) Note: Plot your points in the order in which you would like them connected. Line segments will connect the points automatically.arrow_forward
- Douglas Fur is a small manufacturer of fake-fur boots in Dallas. The following table shows the company’s total cost of production at various production quantities. On the following graph, plot Douglas Fur’s average total cost (ATC) curve using the green points (triangle symbol). Next, plot its average variable cost (AVC) curve using the purple points (diamond symbol). Finally, plot its marginal cost (MC) curve using the orange points (square symbol). (Hint: For ATC and AVC, plot the points on the integer; for example, the ATC of producing one pair of boots is $155, so you should start your ATC curve by placing a green point at (1, 155). For MC, plot the points between the integers: For example, the MC of increasing production from zero to one pair of boots is $95, so you should start your MC curve by placing an orange square at (0.5, 95).) Note: Plot your points in the order in which you would like them connected. Line segments will connect the points automatically.arrow_forwardA particular computing company finds that its weekly profit, in dollars, from the production and sale of x laptop computers is P(x) = -0.006x³ -0.3x² +600x-800. Currently the company builds and sells 7 laptops weekly a) What is the current weekly profit? b) How much profit would be lost if production and sales dropped to 6 laptops weekly? c) What is the marginal profit when x = 7? d) Use the answer from part (a) and (c) to estimate the profit resulting from the production and sale of 8 laptops weekly a) The current weekly profit is $ (Round to the nearest cent as needed) b) The decrease in profit is $ (Round to the nearest cent as needed.) c) The marginal profit when x=7 is $ (Round to the nearest cent as needed) CLOT d) The profit resulting from the production and sale of 8 laptops weekly is approximately $ (Round to the nearest cent as needed)arrow_forwardDouglas Fur is a small manufacturer of fake-fur boots in Chicago. The following table shows the company’s total cost of production at various production quantities. Fill in the remaining cells of the following table. On the following graph, plot Douglas Fur’s average total cost (ATC) curve using the green points (triangle symbol). Next, plot its average variable cost (AVC) curve using the purple points (diamond symbol). Finally, plot its marginal cost (MC) curve using the orange points (square symbol). (Hint: For ATC and AVC, plot the points on the integer; for example, the ATC of producing one pair of boots is $200, so you should start your ATC curve by placing a green point at (1, 200). For MC, plot the points between the integers: For example, the MC of increasing production from zero to one pair of boots is $80, so you should start your MC curve by placing an orange square at (0.5, 80).) Note: Plot your points in the order in which you would like them connected. Line segments…arrow_forward
- You are selling ice cream bars from a cart. You sell them for $0.75 per bar. Your cost for the ice cream is $0.30 per bar, and your cost for the rental of the cart is $50.a) Write a formula for your profit from selling ice cream bars. Be sure to identify all yourvariables and the units used.b) What is the slope of the profit function? What is its meaning in terms of selling icecream bars?c) What is the vertical intercept of the profit function? What is its meaning in terms ofselling ice cream bars?d) What is the horizontal intercept of the profit function? What is its meaning in termsof selling ice cream bars?arrow_forwardSuppose that the Travnikar Corporation manufactures widgets. Analysts that work for the company have found a function C(x) which reports the cost to produce x widgets and a function R(x) which reports the total revenue from selling x widgets. Currently, the company is producing 500 widgets, but the analysts find that R'(500)=85 and C'(500)=79. In order to maximize profits, should the analysts recommend increasing or decreasing production?arrow_forwardThe total revenue curve of a firm is R(x) = 32·5x – 12x2 and itsaverage cost A(x) = x² – 13x + 20 + 200; where x is the firm’s output. 30 x(a). Derive an expression, Π (x), for the firm’s profit function. [Hint: Average Cost = Total Cost quantity (Average cost)(quantity) = Total Cost Or Total Cost = (Average cost)(quantity); where, in this case, quantity is output level, x]. (b). Is the rate of change of profit increasing or decreasing when the output level of the firm is x = 10 and x = 30? (c). Determine the level of output for which profit is maximized. (d). What is the maximum profit.arrow_forward
 Managerial Economics: Applications, Strategies an...EconomicsISBN:9781305506381Author:James R. McGuigan, R. Charles Moyer, Frederick H.deB. HarrisPublisher:Cengage Learning