Concept explainers
Videos
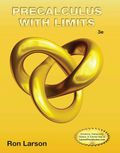
To find: the conclusions can draw from the bar graph.
Explanation of Solution
Given information:
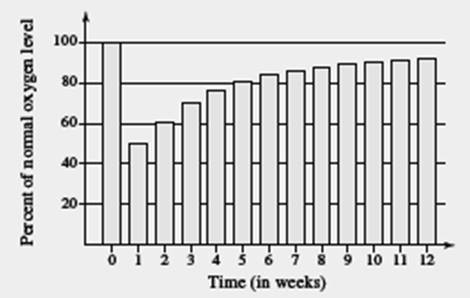
The mathematical model
Gives the percent
Calculation:
Consider the bar graph provided in the book on page number A44 below question number 80.
The bar graph represents that when
Hence you can conclude that at the beginning the oxygen level is 100, for first week the oxygen level reduced to half, after that oxygen level increases, as the value of
Use maple to draw the graph of the mathematical model
Chapter A Solutions
EBK PRECALCULUS W/LIMITS


 Calculus: Early TranscendentalsCalculusISBN:9781285741550Author:James StewartPublisher:Cengage Learning
 Thomas' Calculus (14th Edition)CalculusISBN:9780134438986Author:Joel R. Hass, Christopher E. Heil, Maurice D. WeirPublisher:PEARSON
 Calculus: Early Transcendentals (3rd Edition)CalculusISBN:9780134763644Author:William L. Briggs, Lyle Cochran, Bernard Gillett, Eric SchulzPublisher:PEARSON
 Calculus: Early TranscendentalsCalculusISBN:9781319050740Author:Jon Rogawski, Colin Adams, Robert FranzosaPublisher:W. H. Freeman
 Calculus: Early Transcendental FunctionsCalculusISBN:9781337552516Author:Ron Larson, Bruce H. EdwardsPublisher:Cengage Learning