EBK BUSINESS ANALYTICS
3rd Edition
ISBN: 9780135231906
Author: Evans
Publisher: VST
expand_more
expand_more
format_list_bulleted
Concept explainers
Videos
Textbook Question
Chapter A4, Problem 2PE
Construct histograms using the Histogram chart for the gross sales and gross profit data in the Excel file Sales Data.
Expert Solution & Answer
To determine
To construct histogram for gross sales and gross profit.
Explanation of Solution
Given:
The data contains Customer, Percent gross, gross sales, gross profit, Industry code and competitive rating.
Following is the process to construct histogram for gross sales:
First select column of gross sales then click on
Insert→Charts→Histogram
Histogram for gross sales is:
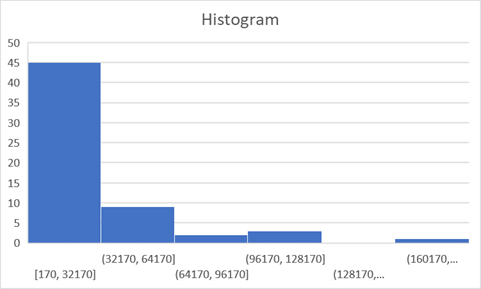
The shape of the distribution of data is right skewed.
Following is the histogram for gross profit:
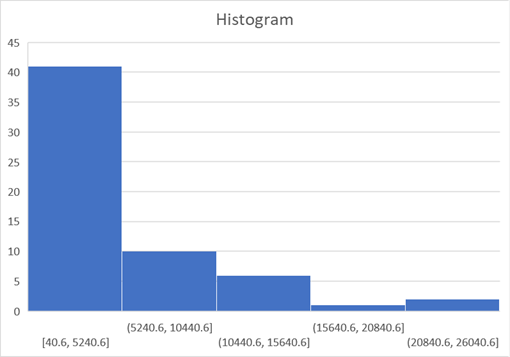
The shape of the distribution of data is right skewed.
Want to see more full solutions like this?
Subscribe now to access step-by-step solutions to millions of textbook problems written by subject matter experts!
Students have asked these similar questions
Please answer the general accounting question not use chatgpt
Given answer accounting questions
General accounting
Chapter A4 Solutions
EBK BUSINESS ANALYTICS
Knowledge Booster


Learn more about
Need a deep-dive on the concept behind this application? Look no further. Learn more about this topic, subject and related others by exploring similar questions and additional content below.Similar questions
arrow_back_ios
SEE MORE QUESTIONS
arrow_forward_ios
Recommended textbooks for you
 BUSN 11 Introduction to Business Student EditionBusinessISBN:9781337407137Author:KellyPublisher:Cengage Learning
 Essentials of Business Communication (MindTap Cou...BusinessISBN:9781337386494Author:Mary Ellen Guffey, Dana LoewyPublisher:Cengage Learning
 Accounting Information Systems (14th Edition)BusinessISBN:9780134474021Author:Marshall B. Romney, Paul J. SteinbartPublisher:PEARSON
 International Business: Competing in the Global M...BusinessISBN:9781259929441Author:Charles W. L. Hill Dr, G. Tomas M. HultPublisher:McGraw-Hill Education
BUSN 11 Introduction to Business Student Edition
Business
ISBN:9781337407137
Author:Kelly
Publisher:Cengage Learning
Essentials of Business Communication (MindTap Cou...
Business
ISBN:9781337386494
Author:Mary Ellen Guffey, Dana Loewy
Publisher:Cengage Learning
Accounting Information Systems (14th Edition)
Business
ISBN:9780134474021
Author:Marshall B. Romney, Paul J. Steinbart
Publisher:PEARSON
International Business: Competing in the Global M...
Business
ISBN:9781259929441
Author:Charles W. L. Hill Dr, G. Tomas M. Hult
Publisher:McGraw-Hill Education
Correlation Vs Regression: Difference Between them with definition & Comparison Chart; Author: Key Differences;https://www.youtube.com/watch?v=Ou2QGSJVd0U;License: Standard YouTube License, CC-BY
Correlation and Regression: Concepts with Illustrative examples; Author: LEARN & APPLY : Lean and Six Sigma;https://www.youtube.com/watch?v=xTpHD5WLuoA;License: Standard YouTube License, CC-BY