![EBK BUSINESS ANALYTICS](https://www.bartleby.com/isbn_cover_images/9780135231906/9780135231906_largeCoverImage.gif)
EBK BUSINESS ANALYTICS
3rd Edition
ISBN: 9780135231906
Author: Evans
Publisher: VST
expand_more
expand_more
format_list_bulleted
Concept explainers
Textbook Question
Chapter A3, Problem 1PE
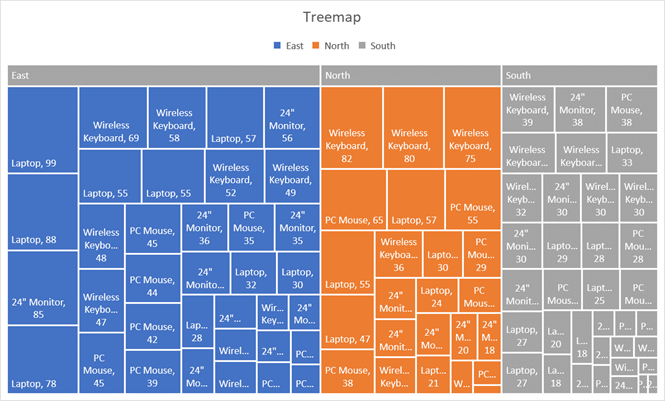
Create a treemap for the regions, items, and units sold in the Excel file Store and Regional Sales Database.
Expert Solution & Answer
![Check Mark](/static/check-mark.png)
To determine
To create a Tree map for the regions, items, and unit sold.
Explanation of Solution
Given:
The data contains ID, Store No., Sales region, Item number, Item description, Unit price, unit sold and week ending.
To create tree map, need to select column of regions, item description, and unit sold.
Now select Insert→Insert Hierarchy chart→Treemap
Following is the Tree map:
Want to see more full solutions like this?
Subscribe now to access step-by-step solutions to millions of textbook problems written by subject matter experts!
Students have asked these similar questions
What can be the segmentation strategy of a stainless steel pan with digital thermometer reading that is powered by the heat generated while cooking?
How can a geographic segmentation method and a benefit segmentation method benefit a stainless steel pan with digital thermometer reading that is powered by the heat generated while cooking?
What external data can I use to support the claim that the consumers living within regions with hot climate will buy the stainless steel pan with digital thermometer reading that is powered by the heat generated while cooking and that sales will be higher in summer?
Using the differentiated targeting strategy, how can we target the home cooks and professional chef segments to buy the stainless steel pan with digital thermometer reading that is powered by the heat generated while cooking?
Using the PESTEL analysis, identify and explain the environmental factors that could affect the launch and commercialization of the stainless steel pan with digital…
As a Sales Head for a consumer durable firm, you wish to have sales forecast trends based on past sales rendered. Briefly describe the methods of forecasting future demand on the basis of past sales.
Select a market or product category for study. Whether it’s a market in which the firm already competes, a new but related market or product category, or a totally new market, the overall market or product category should be clearly defined.
Choose a basis or bases for segmenting the market: There are no foolproof procedures for selecting segmentation variables, but the segmentation scheme must produce segments that meet the four essential criteria discussed earlier in this chapter (substantiality, identifiability, and measurability, accessibility, and responsiveness).
Select segmentation descriptors: Segmentation bases need to be clarified with descriptors to identify the specific segmentation variables to use. For example, if a company selects demographics as a basis of segmentation, it may use age, occupation, income, or some combination of these as descriptors.
Profile and analyze segments: The purpose of this step is to determine the segments’ size, expected growth, purchase…
Chapter A3 Solutions
EBK BUSINESS ANALYTICS
Ch. A3 - Create a treemap for the regions, items, and units...Ch. A3 - Create a sunburst chart for the regions, items,...Ch. A3 - Use PivotTables to find the number of loans by...Ch. A3 - Use PivotCharts to create a useful dashboard for...Ch. A3 - Prob. 6PECh. A3 - Use PivotCharts to create a useful dashboard for...Ch. A3 - Prob. 9PE
Additional Business Textbook Solutions
Find more solutions based on key concepts
Refer to the Real Estate data, which reports information on homes sold in the Goodyear, Arizona, area during th...
Statistical Techniques in Business and Economics
Provide an example of a qualitative variable and an example of a quantitative variable.
Elementary Statistics (Text Only)
Teacher Salaries
The following data from several years ago represent salaries (in dollars) from a school distri...
Elementary Statistics: A Step By Step Approach
(a) Make a stem-and-leaf plot for these 24 observations on the number of customers who used a down-town CitiBan...
Applied Statistics in Business and Economics
The manufacturer of a nationally distributed brand of potato chips wants to determine the feasibility of changi...
Basic Business Statistics, Student Value Edition (13th Edition)
Knowledge Booster
Learn more about
Need a deep-dive on the concept behind this application? Look no further. Learn more about this topic, subject and related others by exploring similar questions and additional content below.Similar questions
- Why is a cross-sectional model of stock price returns likely to produce a more accurate forecast of next year's returns than the market market model?arrow_forwardAs a marketing manager in your company, you were asked to develop a marketing plan for a service that your company would like to bring to market. You can choose to adopt an existing company from a particular industry, or you can choose to create a new one. You are required to prepare the following: To assess marketing opportunities by analysing customers, competitors, and their own company (3Cs), To develop the segmenting, targeting and positioning (STP), and To design effective marketing programs by devising appropriate recommendations for pricing, promotion, place, and services products (4 Ps).arrow_forwardHow would a fast-moving consumer good (FMCG) retailer use collaborative forecasting to improve supply chain performance? 1) manufacturer new product introductions can be better integrated with category assortment plans 2) retail promotional plans can be shared with suppliers to reduce the bullwhip effect 3) retail promotional plans can be shared with suppliers to ensure adequate availability 4) all of the abovearrow_forward
- Retailers commonly track customers’ shopping patterns and target them with special offers. For example, CVS has an Extracare card that, when swiped at checkout, applies discounts to purchases and provides rebates called Extra Bucks to be used as cash on future purchases. Behind the scenes, CVS is gathering data on customers’ purchases and using aggregated data to target individuals with special offers. Customers who haven’t recently shopped may receive a discount in the mail or an online offer to incentivize them to return. Frequent shoppers can scan their Extracare cards to get discounts and offers in the store.Is it right for marketers to track consumer purchases? Discuss other examples of marketers using data collection to sell products. Is this ethical?arrow_forwardRetailers commonly track customers’ shopping patterns and target them with special offers. For example, CVS has an Extracare card that, when swiped at checkout, applies discounts to purchases and provides rebates called Extra Bucks to be used as cash on future purchases. Behind the scenes, CVS is gathering data on customers’ purchases and using aggregated data to target individuals with special offers. Customers who haven’t recently shopped may receive a discount in the mail or an online offer to incentivize them to return. Frequent shoppers can scan Extracare cards to get discounts and offers in the store. Q2-Is it right for marketers to track consumer purchases? Should consumers be concerned with what information is being used? Q3- Discuss other examples of marketers using data collection to sell products. Is this ethical?arrow_forwardIdentify the categories of variables used by Umpqua Bank to segment the business and consumer markets. What additional variables might help the bank define suitable segments for marketing attention?arrow_forward
- To carry out their analysis, planning, implementation, and control responsibilities, marketing managers need a marketing information system (MIS) to assess information needs, develop the needed information, and distribute it in a timely manner. Assume that you are a Marketing Manager of Foodpanda and your company wants you to deploy an efficient Marketing information system. Explain how marketing intelligence will help Foodpanda in collecting information and forecasting demand?arrow_forwardHow can a geographic segmentation method and a benefit segmentation method benefit a stainless steel pan with digital thermometer reading that is powered by the heat generated while cooking?arrow_forwardBuild a Marketing Analytics Toolkit with Cluster Analysis, Choice Models, Conjoint Models and Market Response Modelsarrow_forward
- Briefly explain each of the following e-commerce revenue models by highlighting differences, ( if any) a) Advertising revenue model b) Subscription revenue model c) Transaction fee revenue modelarrow_forwardUsing historical sales data, choose a quantitative technique to forecast sales for that organisation for the next sales period. Comment on the appropriateness of the technique used. (digicel)arrow_forwardBriefly explain how the organization forecast sales for its products (digicel)arrow_forward
arrow_back_ios
SEE MORE QUESTIONS
arrow_forward_ios
Correlation Vs Regression: Difference Between them with definition & Comparison Chart; Author: Key Differences;https://www.youtube.com/watch?v=Ou2QGSJVd0U;License: Standard YouTube License, CC-BY
Correlation and Regression: Concepts with Illustrative examples; Author: LEARN & APPLY : Lean and Six Sigma;https://www.youtube.com/watch?v=xTpHD5WLuoA;License: Standard YouTube License, CC-BY