
Concept explainers
Videos
a.
To identify: The claim and state
a.
Answer to Problem 13E
The claim is that “the variance in the number of calories differs between the two brands”.
Null hypothesis:
Alternative hypothesis:
Explanation of Solution
Given info:
The data shows the areas (in square miles).
Justification:
Here, the claim is that “the variance in area is greater for eastern cities than for western cities”. This can be written as
b.
To find: The critical value for 5% level and 1% level.
b.
Answer to Problem 13E
The critical value at 5% level is 4.950 and the critical value at 1% level is 10.67.
Explanation of Solution
Calculation:
The degrees of freedom for numerator is,
The degrees of freedom for denominator is,
Software Procedure:
Step-by-step procedure to obtain the critical value using the MINITAB software:
- Choose Graph > Probability Distribution Plot choose View Probability> OK.
- From Distribution, choose F.
- Enter Numerator df as 6 and Denominator df as 5.
- Click the Shaded Area tab.
- Choose Probability value and Right Tail for the region of the curve to shade.
- Enter the Probability value as 0.05.
- Click OK.
Output using the MINITAB software is given below:
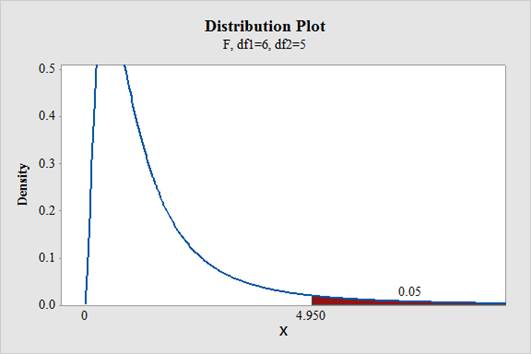
From the output, the critical value is 4.950.
Level of significance,
Software Procedure:
Step-by-step procedure to obtain the critical value using the MINITAB software:
- Choose Graph > Probability Distribution Plot choose View Probability> OK.
- From Distribution, choose F.
- Enter Numerator df as 6 and Denominator df as 5.
- Click the Shaded Area tab.
- Choose Probability value and Right Tail for the region of the curve to shade.
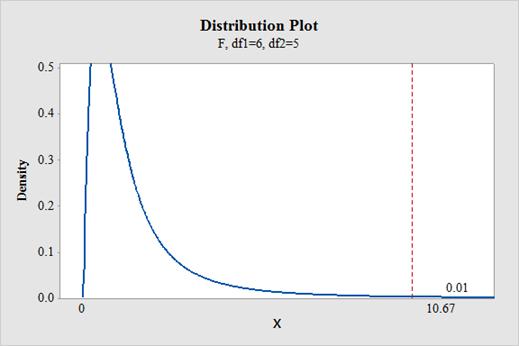
- Enter the Probability value as 0.01.
- Click OK.
Output using the MINITAB software is given below:
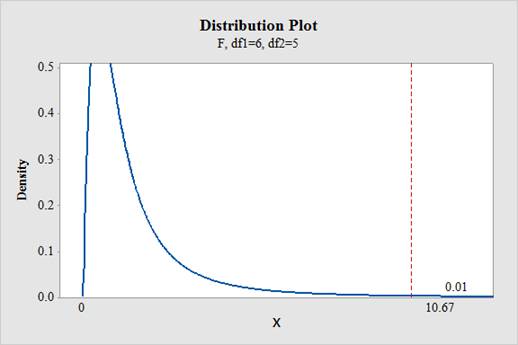
From the output, the critical value is 10.67.
c.
To find: The test value.
c.
Answer to Problem 13E
The test statistic value is 9.80.
Explanation of Solution
Calculation:
Software Procedure:
Step-by-step procedure to obtain the test value using the MINITAB software:
- Choose Stat > Basic Statistics >2 Variance.
- Choose Each sample is in its own column.
- In Sample 1, enter the column of Eastern.
- In Sample 2, enter the column of Western.
- Check Options; enter Confidence level as 95%.
- Choose greater than in alternative.
- Click OK.
Output using the MINITAB software is given below:
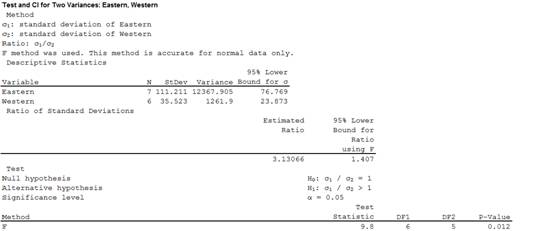
From the output, the test value is 9.80.
d.
To decide: Whether to reject or fail to reject the null hypothesis at a level of significance of
d.
Answer to Problem 13E
For 5% level, the decision is “reject the null hypothesis”.
For 1% level, the decision is “fail to reject the null hypothesis”.
Explanation of Solution
Calculation:
Software Procedure:
Step-by-step procedure to indicate the appropriate area and critical value using the MINITAB software:
- Choose Graph > Probability Distribution Plot choose View Probability> OK.
- From Distribution, choose F.
- Enter Numerator df as 8 and Denominator df as 8.
- Click the Shaded Area tab.
- Choose Probability value and Both Tail for the region of the curve to shade.
- Enter the Probability value as 0.05.
- Enter 9.80 under show reference lines at X values
- Click OK.
Output using the MINITAB software is given below:
From the output, it can be observed that the test statistic value falls in the rejection region. Therefore, the null hypothesis is rejected.
Software Procedure:
Step-by-step procedure to indicate the appropriate area and critical value using the MINITAB software:
- Choose Graph > Probability Distribution Plot choose View Probability> OK.
- From Distribution, choose F.
- Enter Numerator df as 8 and Denominator df as 8.
- Click the Shaded Area tab.
- Choose Probability value and Both Tail for the region of the curve to shade.
- Enter the Probability value as 0.01.
- Enter 9.80 under show reference lines at X values
- Click OK.
Output using the MINITAB software is given below:
From the output, it can be observed that the test statistic value do not falls in the rejection region. Therefore, the null hypothesis is not rejected.
e.
To summarize: The result.
e.
Answer to Problem 13E
The conclusion is that, there is enough evidence to support the claim that the variance in area is greater for eastern cities than for western cities at 5% level of significance.
The conclusion is that, there is no enough evidence to support the claim that the variance in area is greater for eastern cities than for western cities at 1% level of significance.
Explanation of Solution
Justification:
For 5% level:
From part (d), the null hypothesis is rejected. Thus, there is enough evidence to support the claim that the variance in area is greater for eastern cities than for western citiesat 5% level of significance.
For 1% level:
From part (d), the null hypothesis is not rejected. Thus, there is no enough evidence to support the claim that the variance in area is greater for eastern cities than for western cities at 1% level of significance.
Want to see more full solutions like this?
Chapter 9 Solutions
ELEMENTARY STATISTICS W/CONNECT >IP<


 Holt Mcdougal Larson Pre-algebra: Student Edition...AlgebraISBN:9780547587776Author:HOLT MCDOUGALPublisher:HOLT MCDOUGAL
 College Algebra (MindTap Course List)AlgebraISBN:9781305652231Author:R. David Gustafson, Jeff HughesPublisher:Cengage Learning
 Glencoe Algebra 1, Student Edition, 9780079039897...AlgebraISBN:9780079039897Author:CarterPublisher:McGraw Hill
 Calculus For The Life SciencesCalculusISBN:9780321964038Author:GREENWELL, Raymond N., RITCHEY, Nathan P., Lial, Margaret L.Publisher:Pearson Addison Wesley,