
Concept explainers
Videos
Preliminary data analyses indicate that applying the z-test (Procedure 9.1 on page 388) in Exercises 9.83–9.88 is reasonable.
9.83 Toxic Mushrooms? Cadmium, a heavy metal, is toxic to animals. Mushrooms, however, are able to absorb and accumulate cadmium at high concentrations. The Czech and Slovak governments have set a safely limit for cadmium in dry vegetables at 0.5 part per million (ppm). M. Melgar et al. measured the cadmium levels in a random sample of the edible mushroom Boletus pinicola and published the results in the paper “Influence of Some Factors in Toxicity and Accumulation of Cd from Edible Wild Macrofungi in NW Spain” (Journal of Environmental Science and Health, Vol. B33(4), pp. 439-455). Here are the data.
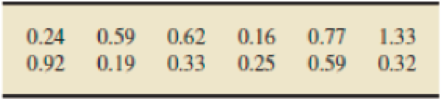
At the 5% significance level, do the data provide sufficient evidence to conclude that the mean cadmium level in Boletus pinicola mushrooms is greater than the government's recommended limit of 0.5 ppm? Assume that the population standard deviation of cadmium
levels in Boletus pinicola mushrooms is 0.37 ppm. (Note: The sum of the data is 6.31 ppm.)
Want to see the full answer?
Check out a sample textbook solution
Chapter 9 Solutions
Introductory Statistics (10th Edition)


- “Normal” BMI is up to 25 kg/m2. A laboratory study is being conducted to determine energy expenditure for those who are overweight and/or obese. The researchers have enrolled only subjects with BMI above 25.0 and have quantified obesity as “units above normal”. For example, a subject with BMI of 32.3 is recorded as 7.3 (i.e. 32.3 – 25.0 = 7.3). Using this scheme, the mean obesity was found to be 8.7 kg/m2and the standard deviation was 6.4 kg/m2. If we convert the obesity measure used in this study back into conventional BMI (i.e., add 25.0 units to each measurement), what will the standard deviation be? Group of answer choices The standard deviation will be larger on the BMI scale because 25.0 units will be added back. The standard deviation will be the same 6.4 kg/m2 There is not enough information to determine this The standard deviation will be smaller on the BMI scale because, as a percentage of the whole scale, the difference between each subject and the mean will be…arrow_forwardIn a Ni-Cd battery, a fully charged cell is composed of nickelic hydroxide. Nickel is an element that has multiple oxidation states. Assume the following proportions of the states: Nickel Charge Proportions Found 0 0.17 +2 0.34 +3 0.33 +4 0.5-0.34 Determine the mean of the nickel charge. Please enter the answer to 2 decimal places.arrow_forwardA researcher believes that the so-called “sugar high” is not real. He gathered 30 adolescents and recorded their activity level in the scale of 0 – 100 (0 = not active and 100 = super active). First, he recorded participants’ activity level before they consumed candy. After recording their pre-sugar activity level, the researcher gave out 5 Snickers bars to participants. Then, he recorded their post-sugar activity level. The average difference between post-sugar and pre-sugar activity level is 50 (i.e., the activity levels are higher after sugar than prior to it) with a standard deviation of 10. A). Complete test statistic and critical values B). Conclusionarrow_forward
- A researcher wonders whether younger mothers have babies that are significantly heavier or lighter than the population average of μ 7.25 pounds. The researcher collects data from N = 35 babies who were born to mothers between the ages of 16 and 18. The average weight for these babies was M = 7.15 pounds (SD = .6 pounds).arrow_forwardIn a manufacturing company, a new production process is being considered to replace the old process presently used. This new process was tested for 10 consecutive hours with the following results: 128, 120, 118, 122, 124, 126, 110, 125, 118. If the average outputs per hour using the old process is 120 units, is the management's claim justified in stating the output per hour can be increased with the new process? Use a = 0.01. a. Null and alternative hypothesis b. Level of significance c. Test statistics to be used and decide whether a one-tailed test or two-tailed test d. Critical value and the rejection region/s e. Compute for the value of test statistic. f. State the decision g. State the conclusion.arrow_forward(a) Identify the claim and state Ho and Ha. Identify the claim in this scenario. Select the correct choice below and fill in the answer box to complete your choice. (Type an integer or a decimal. Do not round.) O A. More than % of adults in the country think that healthy children should be required to be vaccinated. O B. Less than % of adults in the country think that healthy children should be required to be vaccinated. O C. The percentage of adults in the country who think that healthy children should be required to be vaccinated is not %. OD. % of adults in the country think that healthy children should be required to be vaccinated. Let p be the population proportion of successes, where success is an adult in the country who thinks that healthy children should be required to be vaccinated. State Ho and Ha. Select the correct choice below and fill in the answer boxes to complete your choice. (Round to two decimal places as needed.) O A. Hoi p+ O B. Ho: ps Oc. Ho: p2 Haip= Hạ: p> Ha:p…arrow_forward
- A production process is currently operating at + 4.5 a level. a. Calculate the nonconforming ratio for the current process. b. Calculate the nonconforming ratio if the process mean shifts by 1.5 o. ignore the cell belowarrow_forwardAir pollutants common in U.S. cities include fine particulate matter (PM) and ozone (O3). PM is measured as “inhalable” particles 10 micrometers in diameter or “fine inhalable” particles 2.5 micrometers in diameter. Suppose that studies show, for a particular region, that cities exceed PM2.5 standards 20% of the time and exceed ozone standards 10% of the time. Assume that PM2.5 and ozone measurements are statistically independent. A) Determine the probability that a city, selected at random, exceeds one of the standards. B) If a city exceeds the standards, what is the probability that it exceeds only the PM2.5 standard?arrow_forwardOver the past 10 years, contestants at the county fair hotdog eating contest averaged 125 hotdogs within the 1 minute time frame. Due to Covid19 restrictions, there were only 15 contestants who ate an average of 122 hotdogs. s=6.5 We're interested in finding out if there is significant change in hotdog eating. Use the hypothesis that H0: µ=125, Ha: #125. What is the SE? 10.9 1.7 6.5 8.3arrow_forward
- A research center claims that more than 27% of employees in a certain country have changed jobs in the past three years. In a random sample of 340 people from that country, 102 have changed jobs in the past three years. At a=0.01, is there enough evidence to support the center's claim? Complete parts (a) through (e) below. Identity the claim in this scenario. Select the correct choice below and fill in the answer box to complete your choice. (Type an integer or a decimal. Do not round.). OA.% of employees in the country have changed jobs in the past three years. OB. More than % of employees in the country have changed jobs in the past three years. OC. The percentage of employees in the country who have changed jobs in the past three years is not % OD. At most % of employees in the country have changed jobs in the past three years. Let p be the population proportion of successes, where a success is an employee in the country who has changed jobs in the past three years. State Ho and H,…arrow_forwardThe minister of environment in a certain country decided to investigate whether expansion of a aluminum plant in that country would affect fluoride pollution in it's environment. The productions occurred the years 2005 and 2006. One of the things measured was the amount of fluoride in lamb jaws. The data available are measurements of fluoride in the jaws of 8 lambs that were slaughtered in the year 2004 and 8 lambs that were slaughtered in the year 2007. The data is shown below, along with a R output that can simplify your calculations. Fluoride amount 2004 (ug/g) | Fluoride amount 2007 (ug/g) 131.37 655.09 252.74 541.37 81.29 564.58 225.55 617.97 222.44 472.54 68.29 606.62 227.55 500.80 111.86 394.67 > fs2004 fs2007 mean (fs2004) [1] 165.1363 > mean (fs2007) [1] 544.205 > var (fs2004) [1] 5555.906 > var (fs2007) [1] 7348.022 > d mean (d) [1] 379.0688 > var (d) [1] 14657.70arrow_forwardIn an attempt to measure the effects of acid rain, researchers measured the pH (7 is neutral and values below 7 are acidic) of water collected from rain in Ingham County, Michigan. 5.47 5.37 5.38 4.63 5.37 3.74 3.71 4.96 4.64 5.11 5.65 5.39 4.16 5.62 4.57 4.64 5.48 4.57 4.57 4.51 4.86 4.56 4.61 4.32 3.98 5.70 4.15 3.98 5.65 3.10 5.04 4.62 4.51 4.34 4.16 4.64 5.12 3.71 4.64 5.59 Find the quartiles and median of the data. Draw a box plot for the data. Should any points be considered as potential outliers?arrow_forward
 MATLAB: An Introduction with ApplicationsStatisticsISBN:9781119256830Author:Amos GilatPublisher:John Wiley & Sons Inc
 Probability and Statistics for Engineering and th...StatisticsISBN:9781305251809Author:Jay L. DevorePublisher:Cengage Learning
 Statistics for The Behavioral Sciences (MindTap C...StatisticsISBN:9781305504912Author:Frederick J Gravetter, Larry B. WallnauPublisher:Cengage Learning
 Elementary Statistics: Picturing the World (7th E...StatisticsISBN:9780134683416Author:Ron Larson, Betsy FarberPublisher:PEARSON
 The Basic Practice of StatisticsStatisticsISBN:9781319042578Author:David S. Moore, William I. Notz, Michael A. FlignerPublisher:W. H. Freeman
 Introduction to the Practice of StatisticsStatisticsISBN:9781319013387Author:David S. Moore, George P. McCabe, Bruce A. CraigPublisher:W. H. Freeman