Concept explainers
Videos
In 1960, William K. Estes proposed the following model for measuring a student’s performance in the classroom:
where k(t) is the student’s knowledge after t weeks (expressed as a percentage and measured by performance on examinations), ℓ is a constant called the coefficient of learning and representing the student’s ability to learn (expressed as a percentage and determined by IQ or some similar general intelligence predictor), and λ is a constant representing the fraction of available time the student spends performing helpful acts that should increase knowledge of the subject (studying, going to class; and so on). Use this model to solve Problems 79 and 80.
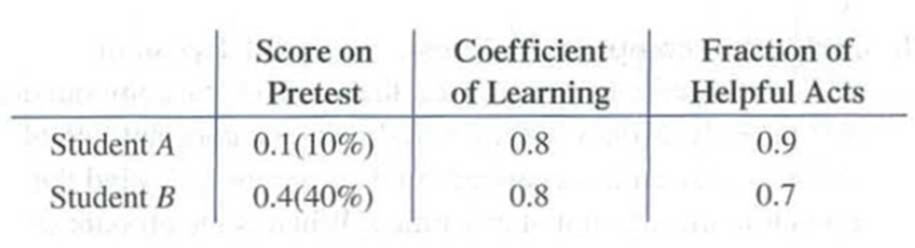
80. Learning theory. Refer to Problem 79. When will both students have the same level of knowledge? Round answer to one decimal place.
79. Learning theory. Students enrolled in a beginning Spanish class are given a pretest the first day of class to determine their knowledge of the subject. The results of the pretest, the coefficient of learning, and the fraction of time spent performing helpful acts for two students in the class are given in the table. Use the Estes model to predict the knowledge of each student after 6 weeks in the class.
Want to see the full answer?
Check out a sample textbook solution
Chapter 9 Solutions
Calculus for Business, Economics, Life Sciences, and Social Sciences (14th Edition)


- Respiratory Rate Researchers have found that the 95 th percentile the value at which 95% of the data are at or below for respiratory rates in breath per minute during the first 3 years of infancy are given by y=101.82411-0.0125995x+0.00013401x2 for awake infants and y=101.72858-0.0139928x+0.00017646x2 for sleeping infants, where x is the age in months. Source: Pediatrics. a. What is the domain for each function? b. For each respiratory rate, is the rate decreasing or increasing over the first 3 years of life? Hint: Is the graph of the quadratic in the exponent opening upward or downward? Where is the vertex? c. Verify your answer to part b using a graphing calculator. d. For a 1- year-old infant in the 95 th percentile, how much higher is the walking respiratory rate then the sleeping respiratory rate? e. f.arrow_forwardTable 3 gives the annual sales (in millions of dollars) of a product from 1998 to 20006. What was the average rate of change of annual sales (a) between 2001 and 2002, and (b) between 2001 and 2004?arrow_forwardTable 6 shows the population, in thousands, of harbor seals in the Wadden Sea over the years 1997 to 2012. a. Let x represent time in years starting with x=0 for the year 1997. Let y represent the number of seals in thousands. Use logistic regression to fit a model to these data. b. Use the model to predict the seal population for the year 2020. c. To the nearest whole number, what is the limiting value of this model?arrow_forward
- Find the equation of the regression line for the following data set. x 1 2 3 y 0 3 4arrow_forwardWhat does the y -intercept on the graph of a logistic equation correspond to for a population modeled by that equation?arrow_forwardTable 4 gives the population of a town (in thousand) from 2000 to 2008. What was the average rate of change of population (a) between 2002 and 2004, and (b) between 2002 and 2006?arrow_forward
 Calculus For The Life SciencesCalculusISBN:9780321964038Author:GREENWELL, Raymond N., RITCHEY, Nathan P., Lial, Margaret L.Publisher:Pearson Addison Wesley,
 Algebra & Trigonometry with Analytic GeometryAlgebraISBN:9781133382119Author:SwokowskiPublisher:Cengage
 Functions and Change: A Modeling Approach to Coll...AlgebraISBN:9781337111348Author:Bruce Crauder, Benny Evans, Alan NoellPublisher:Cengage Learning
 Glencoe Algebra 1, Student Edition, 9780079039897...AlgebraISBN:9780079039897Author:CarterPublisher:McGraw Hill
 Trigonometry (MindTap Course List)TrigonometryISBN:9781337278461Author:Ron LarsonPublisher:Cengage Learning